
Construction and Renovation Financing In an Era of Economic Fragility
Executive Summary
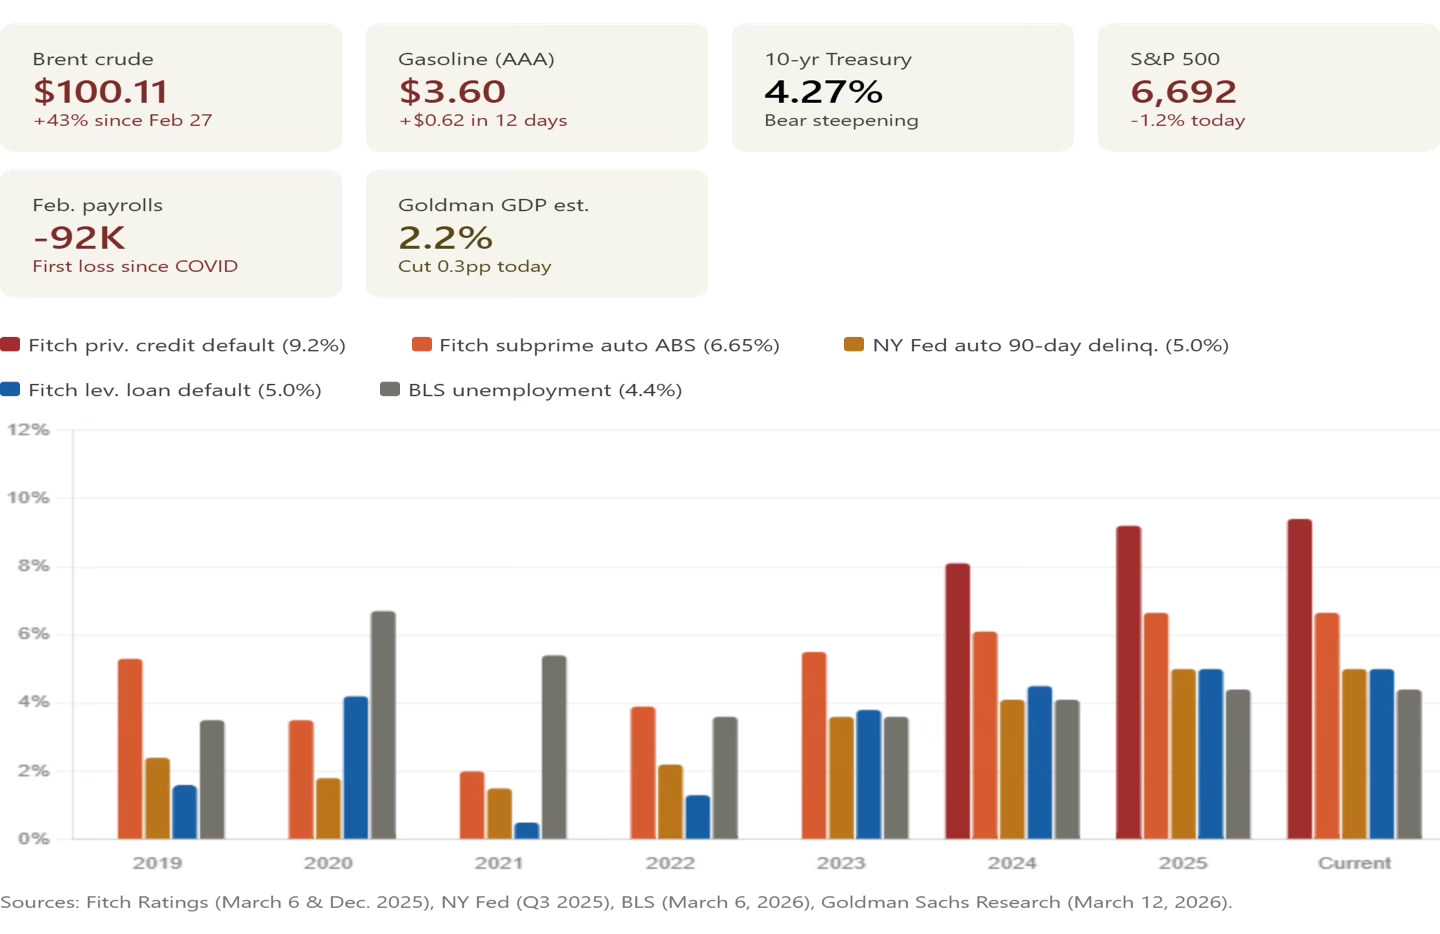
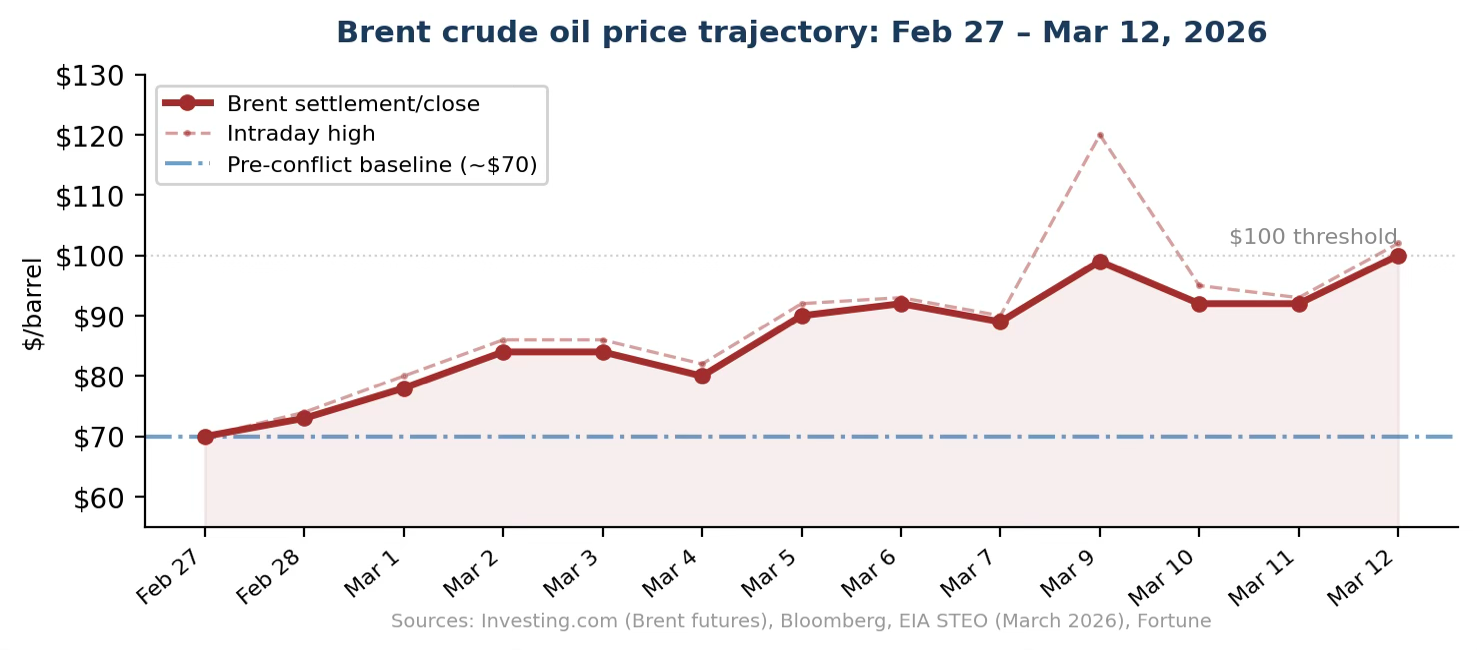
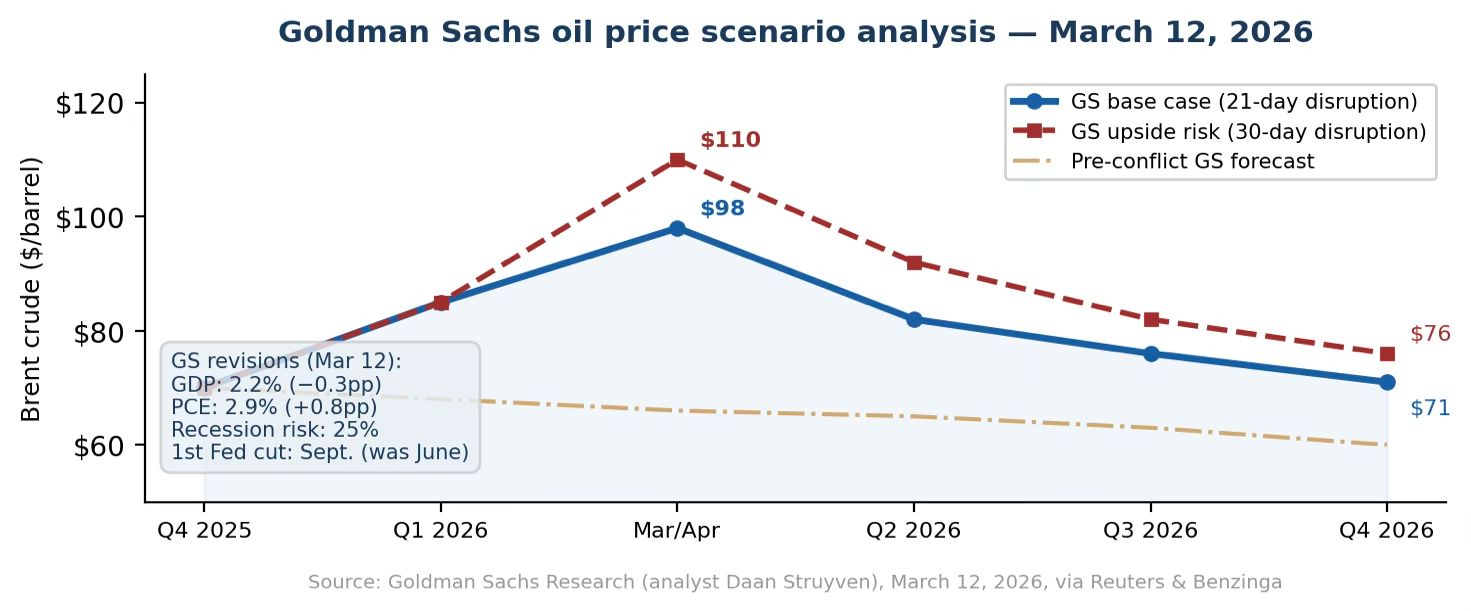
As of March 12, 2026—Day 12 of the U.S.-Israeli military campaign against Iran—economic conditions facing real estate investors has deteriorated further. Despite the International Energy Agency’s announcement of a record 400-million-barrel strategic reserve release — the largest in IEA history — Brent crude soared beyond $100 per barrel on March 12. Part of this surge was a reaction to Iran declaring the Strait of Hormuz would remain closed and struck three more commercial cargo ships in the Arabian Gulf [1][2]. The IEA estimates Gulf production cuts now total at least 10 million barrels per day [3]. The S&P 500 fell 1.2% to 6,692, with the Dow dropping approximately 575 points as stagflation fears ramp up [4]. Goldman Sachs issued a material forecast amendment on March 12, cutting 2026 GDP growth by 0.3%age points to 2.2%, raising headline PCE inflation to 2.9% and recession probability to 25%, and pushing its expected first Fed rate cut from June to September [5]. U.S. gasoline reached $3.60 per gallon nationally per AAA, up 35 cents from the prior week, with California at $5.37 [6].
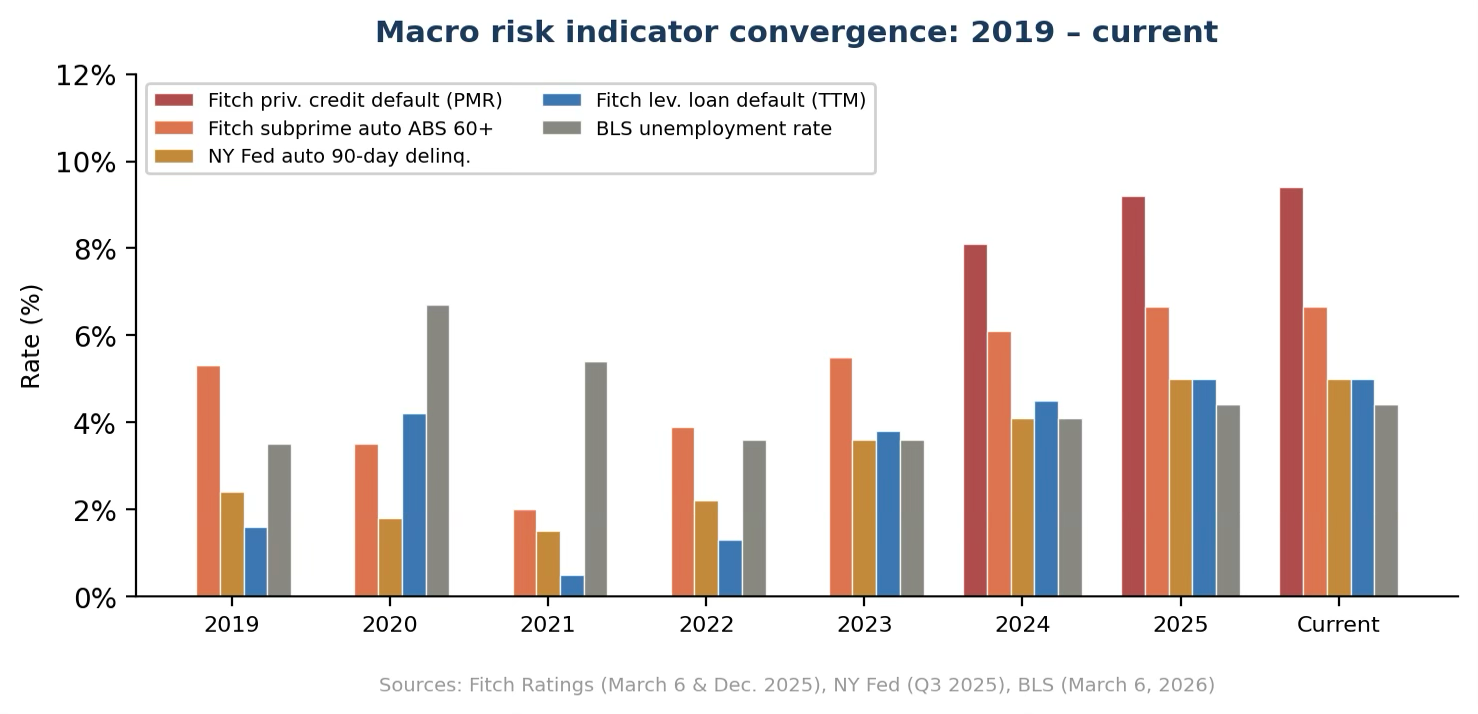
The 10-year Treasury yield rose to approximately 4.27% as yields across the curve maintained their upward trajectory [7]. Morgan Stanley and Cliffwater became the latest institutions to cap withdrawals from private credit funds, deepening concerns about liquidity in transitional real estate financing markets [8]. The EIA’s Short-Term Energy Outlook predicts Brent above $95 for the next two months before falling below $80 in Q3 [9]. Fitch Ratings reported the U.S. private credit default rate at a record 9.2% in 2025, with the leveraged loan TTM default rate at 5.0% [10][11]. Auto loan delinquencies remain at fifteen-year highs per the Federal Reserve Bank of New York [12].
I. The State of Investment Real Estate Construction & Renovation Financing
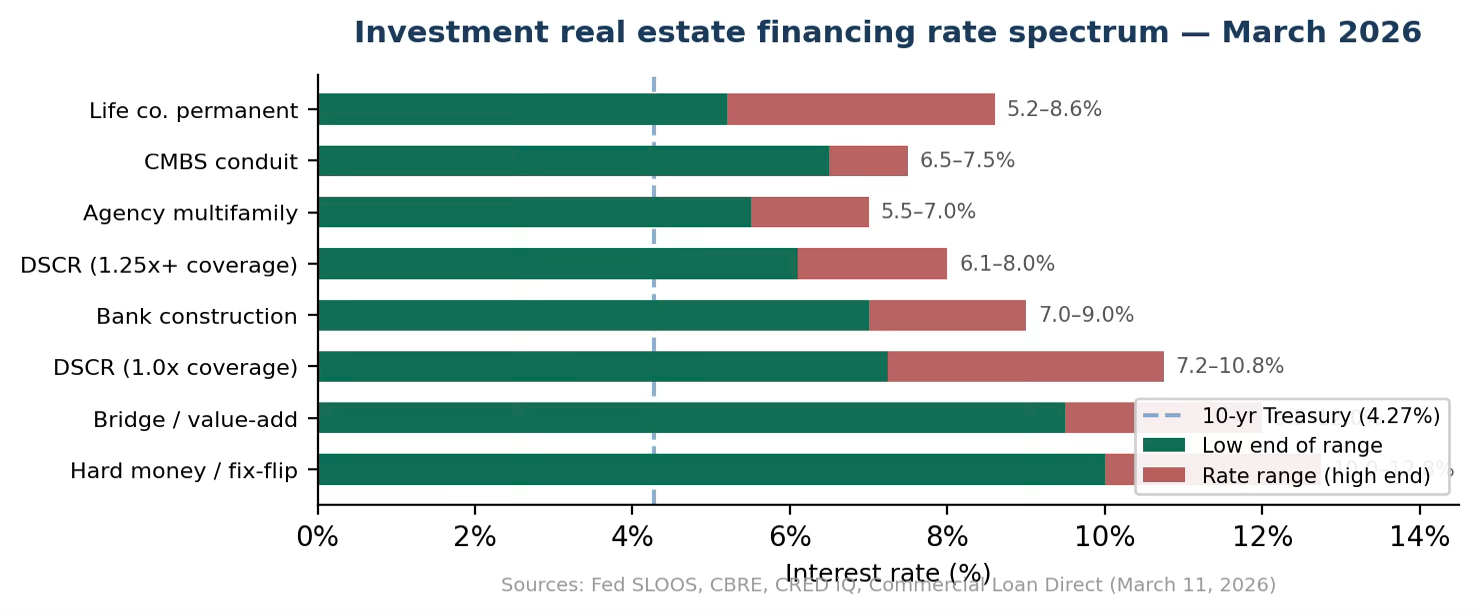
Real estate investors seeking construction and renovation capital are grappling with a lending environment plagued by selective availability, rising benchmarks, and abrupt geopolitical disturbance. As of early March 2026, the financing landscape for investment real estate spans a wide cost-of-capital spectrum: CMBS and life company permanent loans range from approximately 5.2 to 8.6% for stabilized assets; conventional bank construction loans for investor-grade projects fall in the 7 to 9% range; DSCR loans for cash-flowing rental acquisitions and refinances are pricing between 6.1 and 10.75% depending on coverage ratios required and leverage requested; and short-term bridge and hard money capital for value-add rehabilitation and fix-and-flip strategies commands 9.5 to 12.75%, with the highest rates reserved for transitional assets in secondary markets [10][11]. These products are priced using spreads over either the 10-year Treasury (for fixed-rate permanent and CMBS debt) or SOFR (for floating-rate bridge, construction, and mezzanine structures). Therefore, the direction of these benchmarks drives the entire investment lending market. Furthermore, economic conditions are contributing factors that determine the spread-width above these benchmarks.
The Federal Reserve’s January 2026 Senior Loan Officer Opinion Survey (SLOOS) marked a genuine turning point for commercial real estate: for the first time since Q2 2022, banks reported loosening CRE lending standards, with 93% of large banks expecting standards to hold steady or ease further in 2026 [12]. CMBS issuance surged to $115.2 billion through November 2025 (the highest since 2007) and the CBRE Lending Momentum Index, which tracks commercial loan closings, rose 112% year-over-year in Q3 2025 [13]. CRE lending spreads have compressed across all major property types per CRED iQ data: multifamily leads at 152 basis points over Treasuries, industrial at 163, retail at 173, and office—despite ongoing structural headwinds—has narrowed to 223 basis points, still carrying a 71-basis-point premium over multifamily [14]. GSE lending caps for agency multifamily received a 20.5% increase for 2026, and loan demand grew for the second consecutive quarter per the Fed SLOOS [15].
However, the Iran conflict has injected severe uncertainty into this fragile recovery. The 10-year Treasury yield stood at approximately 4.27% on March 12 as yields across the curve maintained their increases amid surging energy prices [7]. The treasury yield curve has undergone a bear steepening that historically compresses bank net interest margins, raises credit risk, and curbs loan demand [4]. In the equity markets, the S&P financials sector has declined approximately 10% year-to-date, with private credit firms (key providers of bridge, mezzanine, and preferred equity capital to real estate investors) suffering losses of 26 to 33%. Morgan Stanley and Cliffwater became the latest to cap withdrawals from private credit funds on March 12, raising concerns about liquidity contagion in the very markets that finance transitional real estate [8]. An estimated $936 billion in commercial mortgages will mature in 2026 per CBRE data, creating intense refinancing pressure for investors holding transitional assets underwritten to pre-conflict rate assumptions [17]. Over 900 banks still carry CRE exposure which exceeds 3 times the value of capital. This is igniting regulatory scrutiny and selective underwriting that favors stabilized, cash-flowing assets over speculative construction and heavy rehabilitation [18]. Deloitte’s 2026 CRE outlook observes that tariffs on U.S. construction materials reached 25 to 30% in 2025 and seem poised to continue, translating to sustained higher material input costs for ground-up or gut-renovation projects, regardless of the prospect of any rate relief [19].
For real estate investors, the practical impact is obvious and painful: capital is available, but primarily for experienced sponsors with stabilized assets, strong DSCR, and low leverage. Speculative ground-up construction, thin-margin rehabilitation, and transitional bridge deals in high-friction regulatory markets face significantly narrower pathways to financing. Investors relying on floating-rate bridge or construction debt (precisely the structures most sensitive to SOFR movements and lender risk appetite) face the greatest exposure to the current volatility. All of which clearly reverses the monetary easing assessments observed in January of this year.
II. Japanese Bond Rate Movements: A Global Transmission Mechanism
On January 20, 2026, Japan’s 40-year JGB yield surged to 4.0% and the 30-year yield jumped approximately 25–30 basis points in its largest single-day move since at least 1999 [38]. As of March 10, the 10-year JGB yield stood at 2.17%, having spiked to 2.22% on Monday, March 9th, a three-week high driven by oil prices exceeding $100. Japan relies on the Middle East for approximately 95% of its crude oil, with roughly 70% transiting the Strait of Hormuz, and the government is considering tapping national oil reserves [6].
Japan’s gross government debt stands at approximately 229.6% of GDP per the International Monetary Fund’s February 2026 Article IV mission. The IMF projects interest payments will double between 2025 and 2031 as existing debt rolls at higher yields [18]. The Bank of Japan has reduced monthly JGB purchases by ¥400 billion per quarter, cutting in half to ¥3 trillion by March 2026, and is no longer the dominant price-setter in its own sovereign bond market [19]. The 30-year yield has recovered to approximately 3.4% from a three-month low of 3.25% [6].
Why this matters: Japanese institutional investors hold trillions in foreign assets including U.S. Treasuries and agency MBS. As domestic yields become attractive in real terms for the first time in two decades, capital repatriation puts selling pressure on the treasury market and in turn serving as upward pressure on U.S. long-term rates (the benchmarks governing construction loans, CMBS pricing, and permanent mortgage financing).
III. Auto Loan Delinquencies: The Consumer Stress Barometer
The Federal Reserve Bank of New York reports that the auto loan 90-day delinquency rate reached 5.0% as of Q3 2025 (Great Recession peak was 5.3%) [7]. Equifax reports the overall 60-plus-day delinquency rate at 1.61% in December 2025 [20]. The Fed Board published analysis in November 2025 confirming that auto loan delinquency rates have raised to Great Financial Crisis levels, with lower-income households showing acute sensitivity in Q3 2025 [21].
Fitch Ratings’ auto ABS tracking shows the most granular detail. Fitch’s subprime-auto ABS 60-plus-day delinquency rate reached 6.65% in October 2025 (highest on record since Fitch began tracking in the early 1990s). The prime auto ABS delinquency rate remained at 0.4% in January 2026, unchanged from January 2018 and well below the Great Recession peak of 0.9% [22]. The divergence between prime and subprime magnifies the true nature of consumer credit stress.
Why this matters: Households struggling with auto payments, alongside 58-cent-per-gallon gasoline spikes in ten days plus diesel at $4.66, cannot absorb rent increases. For renovation investors, the completed middle-market projects buyer pool is below underwriting assumptions.
IV. Corporate Loan Default Rates: Fitch, Moody’s, and Federal Reserve Data
The Federal Reserve Bank of St. Louis (FRED) reports that the delinquency rate on business loans at all commercial banks stood at 1.34% in Q4 2025, with the all-loan delinquency rate at 1.53% [25]. However, the headline picture masks severe stress in specific credit segments, as documented by the major rating agencies.
Fitch Ratings reported on March 6, 2026, that the U.S. private credit default rate rose to a record 9.2% in 2025 in its privately monitored ratings portfolio, above the prior record of 8.1% in 2024. Fitch’s monitor tracked 302 companies, with 38 defaults among 28 different borrowers (mostly consisting of middle-market borrowers with $100 million or less in earnings and approximately $500 million or less in outstanding debt). Fitch identified floating-rate capital structures with minimal interest rate hedging as a primary catalyst, noting that elevated federal funds rates over three years had left these companies’ cash flows abundantly susceptible to default risk [8]. The combined Fitch Private Credit Default Rate, which includes both model-based and privately monitored components, rose to 5.8% through January 2026. Moreover, Fitch reported 11 defaults in February alone, nearly double the 2025 monthly average [26].
Regarding the syndicated market, Fitch’s December 2025 U.S. Corporates Distressed and Default Monitor reported the leveraged loan TTM default rate at 5.0% and high-yield default rate at 2.8%, predicting these levels to remain through 2026-year-end. Fitch noted continued re-default risk for issuers that completed distressed debt exchanges in 2024 and 2025 [9].
Moody’s Analytics agrees, noting the average probability of default for U.S. public companies climbed to 9.2% (a post-financial-crisis high) with the widest disparity between larger/rated versus smaller/unrated borrowers since 2023 [27]. The FED’s October 2025 SLOOS stated tighter lending standards for commercial and industrial borrowers of all sizes, with small firms facing lower credit lines, tighter requirements, and higher use of interest rate floors [28].
Why this matters for construction and renovation financing: The Fitch data is particularly alarming because the private credit borrowers defaulting at 9.2% are precisely the profile of firms that populate real estate construction borrowers: middle-market, floating-rate, and minimally hedged. When subcontractors and material suppliers face this level of credit stress, compounded by surging energy costs, they demand faster payment terms, reduce willingness to carry costs during draw-schedule delays, and in some cases fail mid-project.
V. Unemployment Trends: From Freeze to Contraction
The Bureau of Labor Statistics reported on March 6 that nonfarm payrolls fell by 92,000 in February 2026, the first monthly contraction since the pandemic and far below the Dow Jones consensus estimate of positive 50,000 [3]. The unemployment rate rose to 4.4% from 4.3% in January, approaching November’s four-year high of 4.5% [29]. The BLS noted that total employment fell by 185,000 while the labor force grew modestly, pushing the participation rate down to 62.0% [3].
The labor market had already weakened throughout 2025. Average monthly payroll growth decelerated to just 50,000 jobs, with job openings falling 13% over the year [30]. Net immigration turned negative for the first time since 1935, removing a key labor supply channel [30]. J.P. Morgan Research places the 2026 recession probability at one-in-three, projects GDP growth of just 1.8%, and forecasts unemployment peaking at 4.5% in early 2026 [31]. State Street Global Advisors revised potential growth for 2026 to just 1.0% [32].
Why this matters: The February payrolls report triggered explicit stagflation worries, slowing growth paired with rising energy-driven inflation. For construction investors, this creates a double bind: labor costs are not declining due to immigration-driven supply constraints, while exit values erode as fewer households can absorb rent increases or qualify for purchases. The one-in-three recession probability cited by J.P. Morgan should inform every underwriting assumption.
VI. The Iran Conflict: Day 10 — Escalation Beyond Projections
The U.S.-Israeli campaign launched February 28 has escalated well beyond initial expectations. Iran has struck at least nine countries. Bahrain’s national oil company BAPCO has declared force majeure. More than 1,700 people have been killed across the region per CNN and HRANA reporting. Seven U.S. service members have died per the Department of Defense [33][34].
Oil prices experienced historic volatility: Brent surged from approximately $70 pre-conflict to $119.50 on March 9 before retreating to the $88–92 range on March 10 after President Trump indicated the war may be nearing its end and the IEA signaled potential strategic reserve releases from 1.2 billion barrels held across member states [1][2]. Saudi Aramco’s CEO warned of catastrophic consequences, and Rapidan Energy Group characterized this as the biggest supply disruption in the history of the oil market per CNBC reporting [35]. The reading has returned upward above $100 as of March 12 after the new Supreme Leader of Iran defiantly stated the Strait of Hormuz must remain closed and its military struck 3 more tankers in the area. U.S. gasoline surged to $3.54 per gallon nationally per AAA, with California at $5.20 and diesel at $4.66 [4]. Rystad Energy modeled Brent at $135 under a four-month disruption scenario [36]. The Brookings Institution published analysis noting that Iran’s strategy of imposing high costs on Washington and the global economy represents an existential survival calculation [37].
Why this matters for construction financing: Five major disadvantages currently coexist. First, energy-driven material cost inflation on top of Deloitte-documented 25–30% effective tariffs. Second, diesel at $4.66 directly increases equipment and delivery costs. Third, inflationary pressure pauses Fed easing. Fourth, the bear-steepening yield curve has heavily weighed on financial institutions and private credit firms that provide construction capital. Fifth, unprecedented oil volatility makes lender risk-pricing nearly impossible, widening spreads and delaying closings.
VII. The Convergence: Updated Risk Matrix
The simultaneous presence of a wartime oil shock, a payroll contraction, a bear-steepening yield curve, Japanese bond instability, record Fitch private credit defaults, fifteen-year-high consumer delinquencies, and rising corporate default risk creates a compounding and heavily complex environment of threat unlike anything since 2008. Each factor reinforces the others: the oil shock feeds inflation that prevents rate relief; the payroll decline weakens demand for completed projects; the yield curve movement disrupts banks and credit firms; Japanese capital repatriation adds structural upward pressure on long-term treasury rates; and Fitch’s record 9.2% private credit default rate signals that the mid-market firms comprising the construction supply chain are under existential pressure from floating-rate exposure.
Key Risk Indicators — March 12, 2026 Snapshot
We now recommend cash contingency reserves of 25% above base project budgets, tremendously higher than previous industry standards.
VIII. Strategic Implications for Wealth Retention Clients
Tax Mitigation Considerations
Rising construction costs driven by energy prices and Deloitte-documented tariff pressures amplify the value of cost segregation studies, as higher material expenditures may support accelerated depreciation on qualifying components. Opportunity Zone investments in construction and rehabilitation require careful reassessment of completion timelines against the substantial improvement test. Investors should model the tax impact of extended hold periods if exit markets soften due to the BLS-documented payroll contraction.
Asset Protection Imperatives
The record Fitch private credit default rate—concentrated among the middle-market, floating-rate firms that populate construction supply chains—demands heightened structural protection: single-purpose entity structuring for each project, performance and payment bonds on every engagement, and comprehensive builder’s risk insurance. Investors should specifically review force majeure provisions in all active construction contracts given the ongoing disruption to energy markets and material supply chains. Further, hedging strategies must be pursued to further soften the affect of the environment’s pressure.
Exit Planning in a Tightening Market
With BLS unemployment at 4.4% and rising, payrolls contracting, gasoline consuming a growing share of household budgets, and Fitch documenting record defaults among the borrower class most exposed to construction, disposition timelines must be extended materially. Investors holding rehab projects for resale should model the option value of converting to rental holds. Those with maturing construction debt should begin refinancing immediately—the CBRE-documented $936 billion maturity wall means competition for capital will intensify. Early movers will secure meaningfully better terms.
Conclusion
The environment on March 12, 2026 is the most challenging for real estate capital deployment since the Global Financial Crisis. We are operating in a wartime economy: oil has returned to $100 after the largest strategic reserve release in IEA history proved insufficient to offset the Strait of Hormuz closure, Goldman Sachs has cut GDP and raised inflation forecasts, payrolls have turned negative, private credit fund withdrawals are being capped, and the EIA projects sustained elevated energy prices through mid-year. Wealth Retention advises its clients to stress-test every assumption against Goldman’s upside risk scenario ($110 Brent, 4.5% peak PCE), build 25-percent-plus contingency margins, hedge its natural exposures to offset inherit risks, prioritize capital certainty over return optimization, and maintain the structural protections—tax, legal, and financial—that preserve wealth through exactly the kind of economic fragility we are witnessing today.


David, a resident of West Orange, NJ, shares his home with his wife and two children. Originally from suburban Kansas City, KS, he ventured to the East Coast to pursue his academic ambitions. Having earned both bachelor's and master's degrees in Accounting from Syracuse University, David has been rooted in the vibrant city life of New York since his graduation in 2005. Beyond his 20 years of financial planning expertise, David dedicates time to his passions, which include quality family moments, engaging in recreational sports, sketching delightful cartoons for his children, finding solace in music, and exploring the culinary arts. A sports enthusiast at heart, David closely follows the thrilling journeys of the University of Kansas Jayhawks basketball team, the Kansas City Chiefs, and the ever-iconic New York Yankees.

Material prepared herein has been created for informational purposes only and should not be considered investment advice or a recommendation. Information was obtained from sources believed to be reliable but was not verified for accuracy. It is important to note that federal tax laws under the Internal Revenue Code (IRC) of the United States are subject to change, therefore it is the responsibility of taxpayers to verify their taxation obligations.
Addendum: Sources
All sources are drawn from government agencies, rating agencies, institutional research, and major financial publications.
Government & Central Bank Sources
[3] U.S. Bureau of Labor Statistics, “The Employment Situation — February 2026,” published March 6, 2026. Nonfarm payrolls: −92,000. Unemployment: 4.4%. bls.gov
[6] AAA Fuel Prices / AAA Newsroom, “Rising Pump Prices, Higher Gas Demand as Spring Break Begins,” March 12, 2026. National average $3.598/gal. gasprices.aaa.com
[7] 10-Year Treasury yield data via FRED [DGS10] and Trading Economics; approximately 4.27% on March 12 per multiple sources. Also: Japan 10-Year JGB yield at 2.17–2.22% via Trading Economics interbank quotations.
[9] U.S. Energy Information Administration, Short-Term Energy Outlook (STEO), March 2026. Brent forecast above $95/bbl for two months, below $80 in Q3 2026. eia.gov/outlooks/steo
[12] Federal Reserve Bank of New York, Quarterly Report on Household Debt and Credit, Q3 2025. 90-day auto delinquency at 5.0%.
[13] Board of Governors of the Federal Reserve System, “January 2026 Senior Loan Officer Opinion Survey.” First loosening of CRE standards since Q2 2022. 93% of large banks expect standards to hold or ease.
[18] International Monetary Fund, “Japan: Staff Concluding Statement of the 2026 Article IV Mission,” February 2026. Debt 229.6% of GDP. imf.org
[21] Board of Governors of the Federal Reserve System, “A Note on Recent Dynamics of Consumer Delinquency Rates,” FEDS Notes, November 24, 2025. federalreserve.gov
[25] Federal Reserve Bank of St. Louis (FRED), Delinquency Rate on Business Loans [DRBLACBS], Q4 2025: 1.34%. All Loans [DRALACBN]: 1.53%.
[28] Board of Governors of the Federal Reserve System, “October 2025 Senior Loan Officer Opinion Survey.” Tighter C&I standards confirmed.
[29] U.S. Bureau of Labor Statistics via FRED, Unemployment Rate [UNRATE]. February 2026: 4.4%.
[34] U.S. Department of Defense / CENTCOM, casualty press releases, March 1–9, 2026.
Rating Agency Sources
[8] Fitch Ratings, U.S. Private Credit Default Monitor, published March 6, 2026 (via Reuters). PMR default rate: record 9.2% in 2025, up from 8.1% in 2024. 38 defaults among 28 borrowers in 302-company universe.
[9] Fitch Ratings, “U.S. Corporate Distressed and Default Monitor: December 2025,” published December 19, 2025 (via LSTA). Leveraged loan TTM default rate: 5.0%. High-yield bond TTM default rate: 2.8%. 2026 forecasts: leveraged loans 4.5–5.0%; high yield 2.5–3.0%.
[22] Fitch Ratings, auto asset-backed securities performance data. Subprime ABS 60+ day delinquency: 6.65% in October 2025 (record since early 1990s). Prime ABS 60+ day delinquency: 0.4% in January 2026. (Reported via Marketplace/APM and Wolf Street citing Fitch directly.)
[26] Fitch Ratings, U.S. Private Credit Default Rate (PCDR) update, February 2026 (via Funds Society). Combined PCDR: 5.8% TTM through January 2026. PMR component: 9.4%. 11 default events in February, nearly double the 2025 monthly average.
[27] Moody’s Analytics, “US firms’ default risk hits 9.2%, a post-financial crisis high.” Average probability of default for U.S. public companies. moodys.com
Institutional Research & Industry Sources
[5] Goldman Sachs Research, commodity and economics notes, March 12, 2026 (led by analyst Daan Struyven). GDP cut 0.3pp to 2.2% Q4/Q4; PCE raised to 2.9%; recession risk 25%; first Fed cut pushed to September. Brent base case: $98 Mar/Apr, $71 Q4. Upside scenario: $110 Mar/Apr. Via Reuters, Benzinga, Investing.com.
[8] Trading Economics / CNBC / Financial Times, March 12, 2026. Morgan Stanley and Cliffwater cap withdrawals from private credit funds. Also: private credit firms (Ares, Blackstone, KKR, Apollo) down 26–33% YTD.
[10] Fed SLOOS Oct. 2025 (CRE construction standards); CBRE Research (Q3 2025 loan rate data); Commercial Loan Direct (March 11, 2026 rate table). Investment rates: bank construction 7–9%; CMBS 6.5–7.0%; life company 5.2–8.6%; bridge/hard money 9.5–12.75%.
[11] DSCR loan surveys: LendingOne, HomeAbroad, Investment Property Loan Exchange, Q1 2026. Rates 6.1–10.75%.
[14] CRED iQ, CRE spread analysis (via Commercial Observer, February 2026). Multifamily: 152 bps; Industrial: 163 bps; Retail: 173 bps; Office: 223 bps.
[15] J.P. Morgan, “2026 Commercial Real Estate Trends.” GSE multifamily caps +20.5%.
[17] CBRE Research / District Capital. ~$936B in CRE maturities, 2026. Also confirmed by Deloitte.
[19] Deloitte Insights, “2026 Commercial Real Estate Outlook,” December 2025. 900+ banks with CRE >300% of capital. Tariffs 25–30% on construction goods.
[20] Equifax consumer credit data, December 2025. 60+ day auto delinquency: 1.61%.
[27] Moody’s Analytics, “US firms’ default risk hits 9.2%, a post-financial crisis high.” moodys.com
[30] J.P. Morgan Research, “Will the job market improve in 2026?” Also: J.P. Morgan / Cannatare Report, March 2026 economics analysis.
[32] State Street Global Advisors, potential growth revised to 1.0% for 2026.
[37] Brookings Institution, “After the strike: The danger of war in Iran,” March 2026. brookings.edu
[38] ABN AMRO / Invesco AP / Wright Research on Japan JGB dynamics; BoJ tapering schedule.
Major Financial Publications
[1] Bloomberg, “Latest Oil Market News and Analysis for March 12,” March 12, 2026. Brent near $100; three commercial vessels struck in Arabian Gulf.
[2] CNN, “Oil prices soar above $100 after Iran says Strait of Hormuz will remain shut,” March 12, 2026. IEA: Gulf cuts ~10M bpd. 400M-barrel reserve release confirmed.
[3b] Reuters (via Investing.com), Brent Crude Oil Futures, March 12, 2026. Close: $100.11; range $92.89–$101.53; 52-week: $58.40–$119.50.
[4] CNBC / Trading Economics / Yahoo Finance, equity market data March 12, 2026. S&P 500: 6,692 (−1.23%). Dow: −575 points. Nasdaq: 22,344 (−1.64%). VIX: 26.48.
[33] CNN, comprehensive Iran conflict coverage, Day 10–12. 1,700+ killed; BAPCO force majeure; Strait closure; tanker strikes.
[35] CNBC, March 9–12, 2026. Saudi Aramco CEO warning; Rapidan Energy: biggest supply disruption in oil history. Deutsche Bank: investors pricing in “protracted conflict.”
[36] Rystad Energy VP Janiv Shah (via CNBC, March 9): Brent to $135 under 4-month disruption scenario.