
The Housing Market’s Reckoning: Falling Prices, Rising Inventory, and Corporate Ownership Domination
Introduction: A Market Under Siege
For much of the past decade, the U.S. housing market was built on one thing: cheap money. Mortgage rates under 3%, paired with trillions in Federal Reserve stimulus, created the fastest home-price appreciation in modern history. Between 2020 and 2022, home values soared nearly 40%, far outpacing wage growth and pulling in not only families, but also institutional investors seeking yield.1
But that era is over. The Fed’s “higher-for-longer” stance has doubled the cost of borrowing, with the average 30-year mortgage now stuck near 6.7%.2 Affordability has collapsed to 40-year lows, and monthly payments on a median home are nearly twice what they were just four years ago. The Fed bears some blame here. By relying on lagging shelter inflation data in the CPI, it held rates too low for too long during the pandemic surge—fueling housing excess—and then tightened too aggressively once the market was already slowing.3 The result is a policy-induced freeze: buyers priced out, sellers locked in.
The cracks are clear. Inventory is rising, homes are sitting longer, and more sellers are cutting prices. Asking prices are flattening, and in some metros, sale prices are slipping outright. The S&P CoreLogic Case-Shiller Index, the gold standard for valuations, shows the slowest annual growth since 2012, with month-to-month declines since early 2025.4
Meanwhile, the multifamily sector—once Wall Street’s darling—faces oversupply and rent stagnation. Developers, emboldened by zero-rate financing, built too much luxury supply. With refinancing costs now at 6–8%, many projects are cash-flow negative.
And ownership itself is shifting. Institutional landlords, led by Blackstone, now use algorithmic platforms and AI bidding models to purchase homes in bulk, often outbidding families. In markets like Atlanta, Dallas, and Phoenix, their concentrated holdings give them disproportionate power over pricing.
Finally, beyond today’s numbers sits the shadow inventory of Baby Boomer homes. Boomers own nearly 40% of U.S. housing stock.5 Between 2026 and 2036, an estimated 13–15 million homes will hit the market as owners age, downsize, or pass estates to heirs.6 That supply isn’t visible in the data today—but it will be a decisive force tomorrow.
This is not a 2008-style crash, but it is a grinding, structural correction—driven by policy missteps, affordability collapse, oversupply, demographic waves, and the growing power of institutional landlords.
Asking Prices Falter: Sellers Lose Their Grip
The first signs of stress in a housing cycle rarely show up in closed sales—they emerge in the asking prices that sellers post. These list prices are often anchored to the rapid appreciation of prior years, but buyers today face an entirely different reality. With mortgage rates near 6.7% and monthly payments on a median home nearly double what they were just four years ago, affordability has collapsed. That mismatch between what sellers want and what buyers can pay is now playing out nationwide. The result: weaker price growth, rising discount rates, and homes lingering on the market longer than at any time since the pandemic boom.
Key Trends (Redfin Weekly Housing Market Data, July 2025)7
- Median Asking Price
- $407,000 for the four weeks ending July 13, 2025.
- Growth of +2.9% YoY, a sharp slowdown from the double-digit gains of 2021–2022.
- Earlier in July: $403,000 (+2.2% YoY) → the weakest pace in nearly two years.
- Discounts on Listings
- 22% of homes for sale in July cut their asking price.
- Up from ~14% in July 2024 and just ~8% at the 2021 peak, when bidding wars dominated.
- Regional Pressure Points
- Phoenix, Austin, Las Vegas: more than 25% of listings marked down.
- Western and Sun Belt metros, which saw the sharpest pandemic surges, are now leading the reversal.
- Median Days on Market (DOM)
- July 2025: 28 days.
- July 2024: 21 days.
- Pandemic peak (2021): 10–12 days.
- Rising DOM is a reliable precursor to broader price reductions, as sellers adjust to weaker demand.
- Inventory Sensitivity
- Even modest increases in listings are triggering faster discounting.
- Markets that overshot most in the boom—Phoenix, Austin, Boise—are showing the most aggressive markdowns.
Asking prices—once the strongest indicator of housing demand—are flattening nationwide. More homes are being discounted, listings are sitting longer, and the markets that soared the fastest are leading the way down.
Sale Prices Slip: Momentum Broken
If asking prices are the first cracks in a housing cycle, sale prices are the confirmation. Closed transactions reveal what buyers are actually willing (and able) to pay—and those numbers now confirm that the post-pandemic surge has broken. After years of double-digit gains, home-price growth has slowed to its weakest pace in more than a decade, with inflation-adjusted values effectively flat in many markets.
Key Trends (Redfin, NAR, Case-Shiller Data – Summer 2025)
- National Price Declines
- Redfin Home Price Index fell –0.1% MoM in July 2025, the third straight monthly decline.
- Year-over-year growth: just +2.9%, the slowest since 2012 (vs. +20% at the 2021 peak).
- NAR median existing-home price: $422,400 in July, up only +0.2% YoY—flat after inflation.8
- Regional Weakness Emerging
- Oakland: –6.8% YoY
- Austin: –4.9% YoY
- West Palm Beach: –4.2% YoY
- Jacksonville: –2.8% YoY
- Other metros—including Las Vegas, Denver, and Phoenix—have tipped into month-over-month declines.
- Case-Shiller 20-City Index9
- May 2025: national index up +2.3% YoY but down –0.3% MoM.
- 15 of the 20 largest metros posted outright monthly price drops, underscoring broad weakness.
- Transaction Volume
- Closed sales down ~15% YoY (Redfin).
- Lower volume compounds price weakness by reducing liquidity in the market.
- Inflation-Adjusted Declines
- Nominally flat or slightly positive YoY gains mask real declines once CPI is factored in.
- In real terms, housing wealth is already contracting in most metros.
The era of breakneck price momentum is over. Sales data confirms that appreciation has not just slowed but stalled, with declines broadening across metros. Unlike the asking side, where sellers can hold out, closed transactions provide the hard evidence: buyers are unwilling or unable to stretch further, and the market is resetting accordingly.
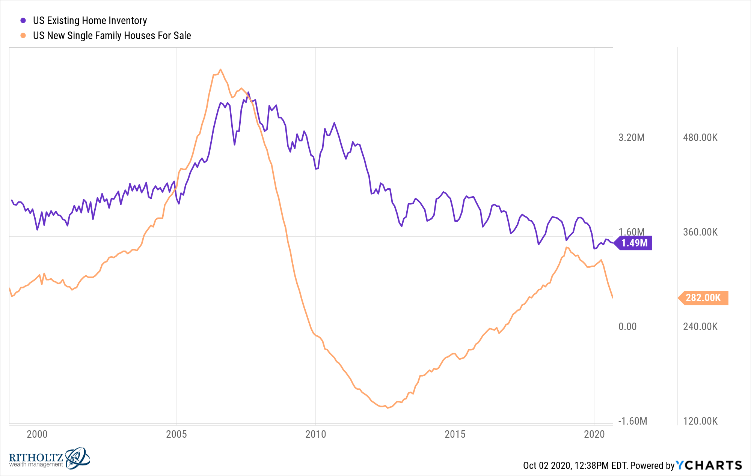
Supply Pressures: Inventory, Case-Shiller & Builders Holding Back
If softening sale prices confirm demand weakness, Case-Shiller adds another dimension: a clear signal that supply and pricing pressures are deepening together. In May 2025, the national index showed values rising just 2.3% year-over-year but falling 0.3% month-over-month, the fourth consecutive decline. That same weakness spreading across metros is being reinforced by what’s happening on the supply side.
Active listings topped 2 million in July, a 7.2% increase from last year, pushing months’ supply to 4.6—the highest since 2020 and edging toward surplus territory.10 Sellers are responding with markdowns, with 22% of homes cutting list prices, more than double the rate at the peak of 2021’s frenzy. On the surface, these figures suggest a manageable increase in available housing, but they don’t capture the full picture.
Builders are deliberately shaping what shows up in the data. Many have slowed down work on homes that are nearly complete—holding back at the landscaping, interior finish, or permitting stages—so the units don’t enter the Census “completed” category. This practice conceals a quiet backlog of near-finished homes that could hit the market quickly once conditions change.
Even with these efforts, the number of finished but unsold homes is still climbing. Census Bureau data show 119,000 such units as of February 2025, just below December’s peak of 124,000—the highest since 2009 and nearly 50% higher than a year ago.11 Unlike paused construction, these homes already carry the full weight of maintenance and financing costs. Sooner or later, that financial pressure will force more of them onto the market.
Taken together, Case-Shiller’s downturn, the rise in visible listings, and the shadow stock of unsold homes point to a supply picture more fragile than the headline numbers suggest. What looks like a modest buildup is, in reality, layered with hidden inventory that makes the market far more vulnerable to deeper correction.
The Lock-In Effect: Affordability Gap and Frozen Mobility
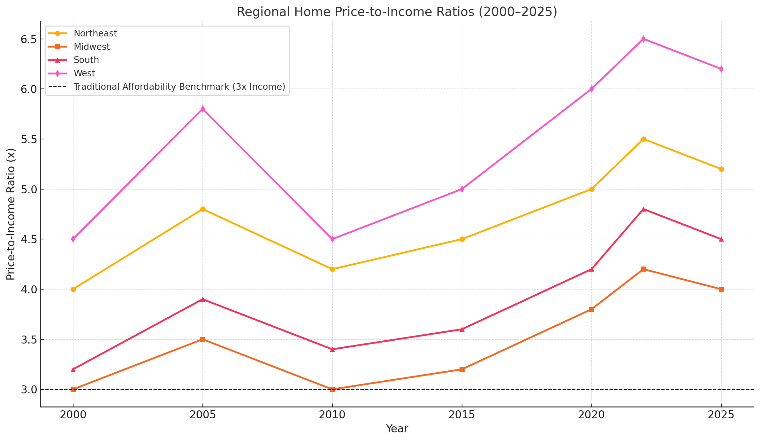
One of the defining features of today’s slowdown isn’t oversupply—it’s the affordability gap. Home prices rose nearly 40% between 2020 and 2022, while household incomes grew less than 15%. At the same time, mortgage rates more than doubled from pandemic lows. The result is the sharpest deterioration in housing affordability in four decades.
The National Association of Realtors’ Housing Affordability Index has collapsed to its lowest level since the early 1980s. Where a median-income family could once qualify for a median-priced home, today they fall well short. A $420,000 home purchased with a 3% mortgage in 2021 required monthly payments of about $1,400. At today’s 6.7% rate, that same home costs nearly $2,800 per month before taxes and insurance. Buyers cannot close that gap, and sellers, anchored to yesterday’s appreciation, resist cutting prices enough to make homes affordable again.
This affordability crisis dovetails with the lock-in effect. Nearly 80% of existing mortgage holders carry rates below 5%, and about 60% are below 4%.12 Roughly one-quarter locked in below 3.5% during the depths of the pandemic. For these owners, moving is economically irrational: selling and buying again means giving up an ultra-low mortgage and doubling monthly payments. That reality has frozen mobility.
Existing home sales are running at an annualized 3.9 million units, according to NAR—levels not seen since 2010. In the five years before the pandemic, sales averaged 5.3–5.5 million. That missing 1.5 million transactions a year represents a 30% collapse in housing liquidity.
The lock-in effect hits some regions harder than others. Western metros that saw the biggest pandemic price spikes also saw the most refinancing, leaving families especially immobile. Ironically, in a few markets like Chicago and Boston, this scarcity of listings has temporarily cushioned prices. But it sets up a delayed adjustment: once rates drift lower, or life events force sales, pent-up supply will return.
Unlike 2008, this cycle is not about forced foreclosures flooding the market—it is about too little turnover. That distinction explains why prices haven’t collapsed outright, but it also explains why the market feels paralyzed. Buyers can’t afford to buy, sellers won’t sell, and mobility has frozen. The affordability gap is the connective tissue here: it both locks households in place and locks new buyers out, creating a grinding stalemate that keeps the housing market from clearing.
Shadow Inventory: Baby Boomer Homes Ahead
If the lock-in effect defines today’s supply shortage, the shadow inventory of Baby Boomer homes defines tomorrow’s flood. Homeowners 65 and older now control nearly 40% of U.S. housing wealth, or about $19 trillion in equity.
Between 2026 and 2036, an estimated 13–15 million Boomer-owned homes will hit the market as owners age, downsize, or pass estates to heirs. That volume is staggering—equivalent to adding 250,000 surplus units annually over a decade, rivaling new construction levels. Unlike forced sales, these transitions will be gradual, but their scale will reshape supply dynamics.
Berkshire Hathaway HomeServices has warned repeatedly that demographics are destiny here. In a 2025 market outlook, the firm cautioned:
“What Boomers will leave behind when they vacate their homes… is a growing number of vacant and listed homes. The impact will not be sudden, but its cumulative effect over a decade will be decisive.”
The impact won’t be evenly distributed. Slower-growth regions in the Midwest and Northeast, where absorption capacity is weakest, will be most disrupted. Faster-growth Sun Belt metros may absorb inventory more easily, but institutional buyers are likely to step in, consolidating ownership further. As Berkshire put it:
“Markets with weaker in-migration will feel the full weight of demographic turnover. In high-demand metros, institutional capital will become the buyer of last resort.”
Today’s “tight” supply picture is, in reality, temporary. Locked-in homeowners are freezing listings, but once demographics assert themselves, that freeze will give way to excess.
Corporate Landlords: Blackstone Leads the Pack—and Signals More to Come
The other side of the ownership story is institutional. As Boomers release homes, large landlords and private equity firms stand ready to absorb them. Unlike individual homeowners, these firms operate with scale, algorithms, and securitized financing, giving them leverage over both acquisition and pricing dynamics.
Key Players & Scale
- Blackstone
- Operates through BREIT and Tricon Residential, with holdings concentrated in Atlanta, Dallas, Charlotte, Tampa, and coastal cities.
- Seeded Invitation Homes.
- Invitation Homes
- The largest single-family rental (SFR) operator.
- Owns and manages 110,388 homes as of June 2025.
- Plans to expand with $1 billion earmarked for acquisitions in 2025, after buying 3,200 homes in 2023.
- American Homes 4 Rent (AMH)
- Portfolio of roughly 61,500 homes nationwide.
- Heavy exposure in Sun Belt markets.
- Progress Residential
- Owns and manages about 85,000 homes across 30 metros.
- Rapid growth in high-demand, high-migration markets.
Market Impact
- Pricing Power
- In Atlanta, just three corporate landlords control nearly 11% of rental housing, enough to influence local rent levels and inventory availability.
- Operational Advantages
- Can buy at scale using AI-driven acquisition platforms and securitized funding.
- Capable of holding vacant units longer than small landlords, allowing them to time rent growth cycles.
- Absorption of Shadow Inventory
- Well-positioned to absorb Boomer-owned homes as they hit the market between 2026–2036.
- In practice, this means consolidation of ownership rather than a broad dispersal to families.
Institutions don’t just participate in the market—they shape it. By controlling large blocks of inventory, they can toggle acquisitions, withhold supply, and dictate local rent trajectories in ways individual sellers cannot. As the demographic wave of Boomer homes collides with ongoing affordability challenges, corporate landlords will play a decisive role in determining who really owns America’s housing stock.
Multifamily: Oversupply, Flat Rents, and Rising Risk
The apartment sector—once a bright spot for investors—is now confronting a headwind trio of excess supply, sluggish or falling rents, and a looming wall of debt.
Construction has outpaced absorption. In July 2025, starts for buildings with five or more units hit 470,000, a 27% year-over-year jump.13 Completions slowed to 385,000 units, down nearly 30% year-over-year, but the backlog remains huge: more than half a million units are expected to deliver this year, just below 2024’s record wave.
Rents are rolling over. Yardi Matrix reports the national average rent rose just $2 in July to $1,754, up 0.7% year-over-year—the weakest since 2010.14 In the Sun Belt, rents are falling outright: Austin is down 4.6%, Phoenix 3.1%. Apartment List shows the national median rent at $1,402 in July, down 0.8% year-over-year—the third straight month of decline. Realtor.com data show two years of consecutive rent drops for 0–2 bedroom units.
Vacancy rates are climbing near 8% nationally and are poised to rise further as new completions hit.15 Meanwhile, nearly $957 billion in multifamily and commercial mortgages mature in 2025. Refinancing at today’s 6–8% rates will crush coverage ratios, with CMBS delinquency rates already rising to 7.23% in July.
Investors hoping for rent growth to offset new supply will be disappointed. Affordability caps limit landlords’ ability to pass on costs, and real rents are already falling. The forward bias is clearly negative: supply will remain heavy, margins will compress, and distress will ripple outward from the weakest owners.
Conclusion: A Grinding Correction, Magnified by Institutions
The housing market is weakening across every front. Asking prices are softening. Sale prices are slipping. Supply is building—both visible and hidden. Multifamily rents are stagnating or falling. Corporate landlords are reshaping ownership. And millions of Boomer-owned homes sit just beyond the horizon.
This is not a 2008-style collapse. Homeowners are equity-rich, and banks aren’t stuffed with toxic loans. But it is a grinding correction—driven by affordability collapse, oversupply, and institutional dynamics.
The Federal Reserve will eventually cut rates, but even a return to its so-called “neutral” stance won’t undo the affordability shock. Mortgage rates at 5% instead of 7% may help on the margin, but home prices remain far above pre-pandemic levels, and wage growth has not kept pace. For the median household, the math simply doesn’t work.
That means the current path—of gradual rate cuts—is unlikely to reset housing affordability in any meaningful way. Instead, it will prolong the stalemate: owners unwilling to sell, buyers unable to buy, institutions opportunistically filling the gap, and supply pressure from Boomer homes looming in the background.
Cheap money built this boom. Expensive money exposed its fragility.


I'm Joshua, a financial advisor from Reno, Nevada. As someone who co-founded and built a trust company and investment advisory firm from the ground up, I’m passionate about sharing the lessons I've learned on my financial journey of 30+ years to guide and empower clients to secure their financial futures. Using active macroeconomic quantitative and tax avoidance strategies, I mitigate risk and help families achieve lasting financial independence, acting as guardians for future generations. Trust, consistency, and accessibility are at the heart of all my long-lasting client relationships.

Joshua Barone is an investment advisor representative with Savvy Advisors, Inc. (“Savvy Advisors”). Savvy Advisors is an SEC registered investment advisor. Material prepared herein has been created for informational purposes only and should not be considered investment advice or a recommendation. Information was obtained from sources believed to be reliable but was not verified for accuracy. All investments involve risk, including loss or principal investment.
Ancora West Advisors, LLC dba Universal Value Advisors (“UVA”) is an investment advisor firm registered with the Securities and Exchange Commission. Savvy Advisors, Inc. (“Savvy Advisors”) is also an investment advisor firm registered with the SEC. UVA and Savvy are not affiliated or related.
Material prepared herein has been created for informational purposes only and should not be considered investment advice or a recommendation. Information was obtained from sources believed to be reliable but was not verified for accuracy. All investments involve risk, including loss of principal. Alternative investments and private placements involve a high degree of risk and can be illiquid due to restrictions on transfer and lack of a secondary trading market. They can be highly leveraged, speculative and volatile, and an investor could lose all or a substantial amount of an investment. Alternative investments may lack transparency as to share price, valuation and portfolio holdings. Prospective investors are advised that investment in a private fund or alternative investment strategy is appropriate only for persons of adequate financial means who have no need for liquidity with respect to their investment and who can bear the economic risk, including the possible complete loss, of their investment. All advisory services are offered through Savvy Advisors, Inc., an investment advisor registered with the Securities and Exchange Commission (“SEC”).
Resources
3 https://www.advisorperspectives.com/articles/2025/08/29/bitcoin-etfs-rising-tide-leverage
5 https://www.realestatenews.com/2025/07/22/boomers-now-hold-nearly-40-of-us-housing-wealth
6 https://www.fanniemae.com/media/20281/display
7 https://www.redfin.com/us-housing-market
8 https://qz.com/housing-market-sales-increase-price-drop-mortgage
10 https://www.realtor.com/advice/buy/buyers-market-how-to-tell/
11 https://www.census.gov/programs-surveys/acs/news/updates/2025.html
12 https://www.realtor.com/news/trends/mortgage-rates-below-6-percent-august-2025/
13 https://www.multifamilydive.com/news/apartment-starts-multifamily-permits-census-data/758209/
14 https://www.yardimatrix.com/blog/national-multifamily-market-report/

