
What a U.S.–Iran Conflict Amid Global Economic Fragility Means for You
Executive Summary
A prolonged U.S.–Iran military conflict layered onto existing sovereign debt fragility and structural shifts in global capital flows would represent more than a geopolitical disruption. It could constitute a structural repricing of sovereign risk. Brent crude could sustain $150–$180 per barrel with spikes above $200 (Goldman Sachs Global Investment Research, Feb 2026). The 10-Year Treasury could reprice toward 6.00%–6.50% (FRED; CBRE historical spreads Q4 2025). Commercial real estate cap rates could expand 125–150 basis points, driving 15–25% asset value declines independent of NOI contraction. For family offices stewarding multi-generational capital, the primary objective shifts from yield maximization to liquidity preservation and liability containment.
I. Energy Shock Transmission
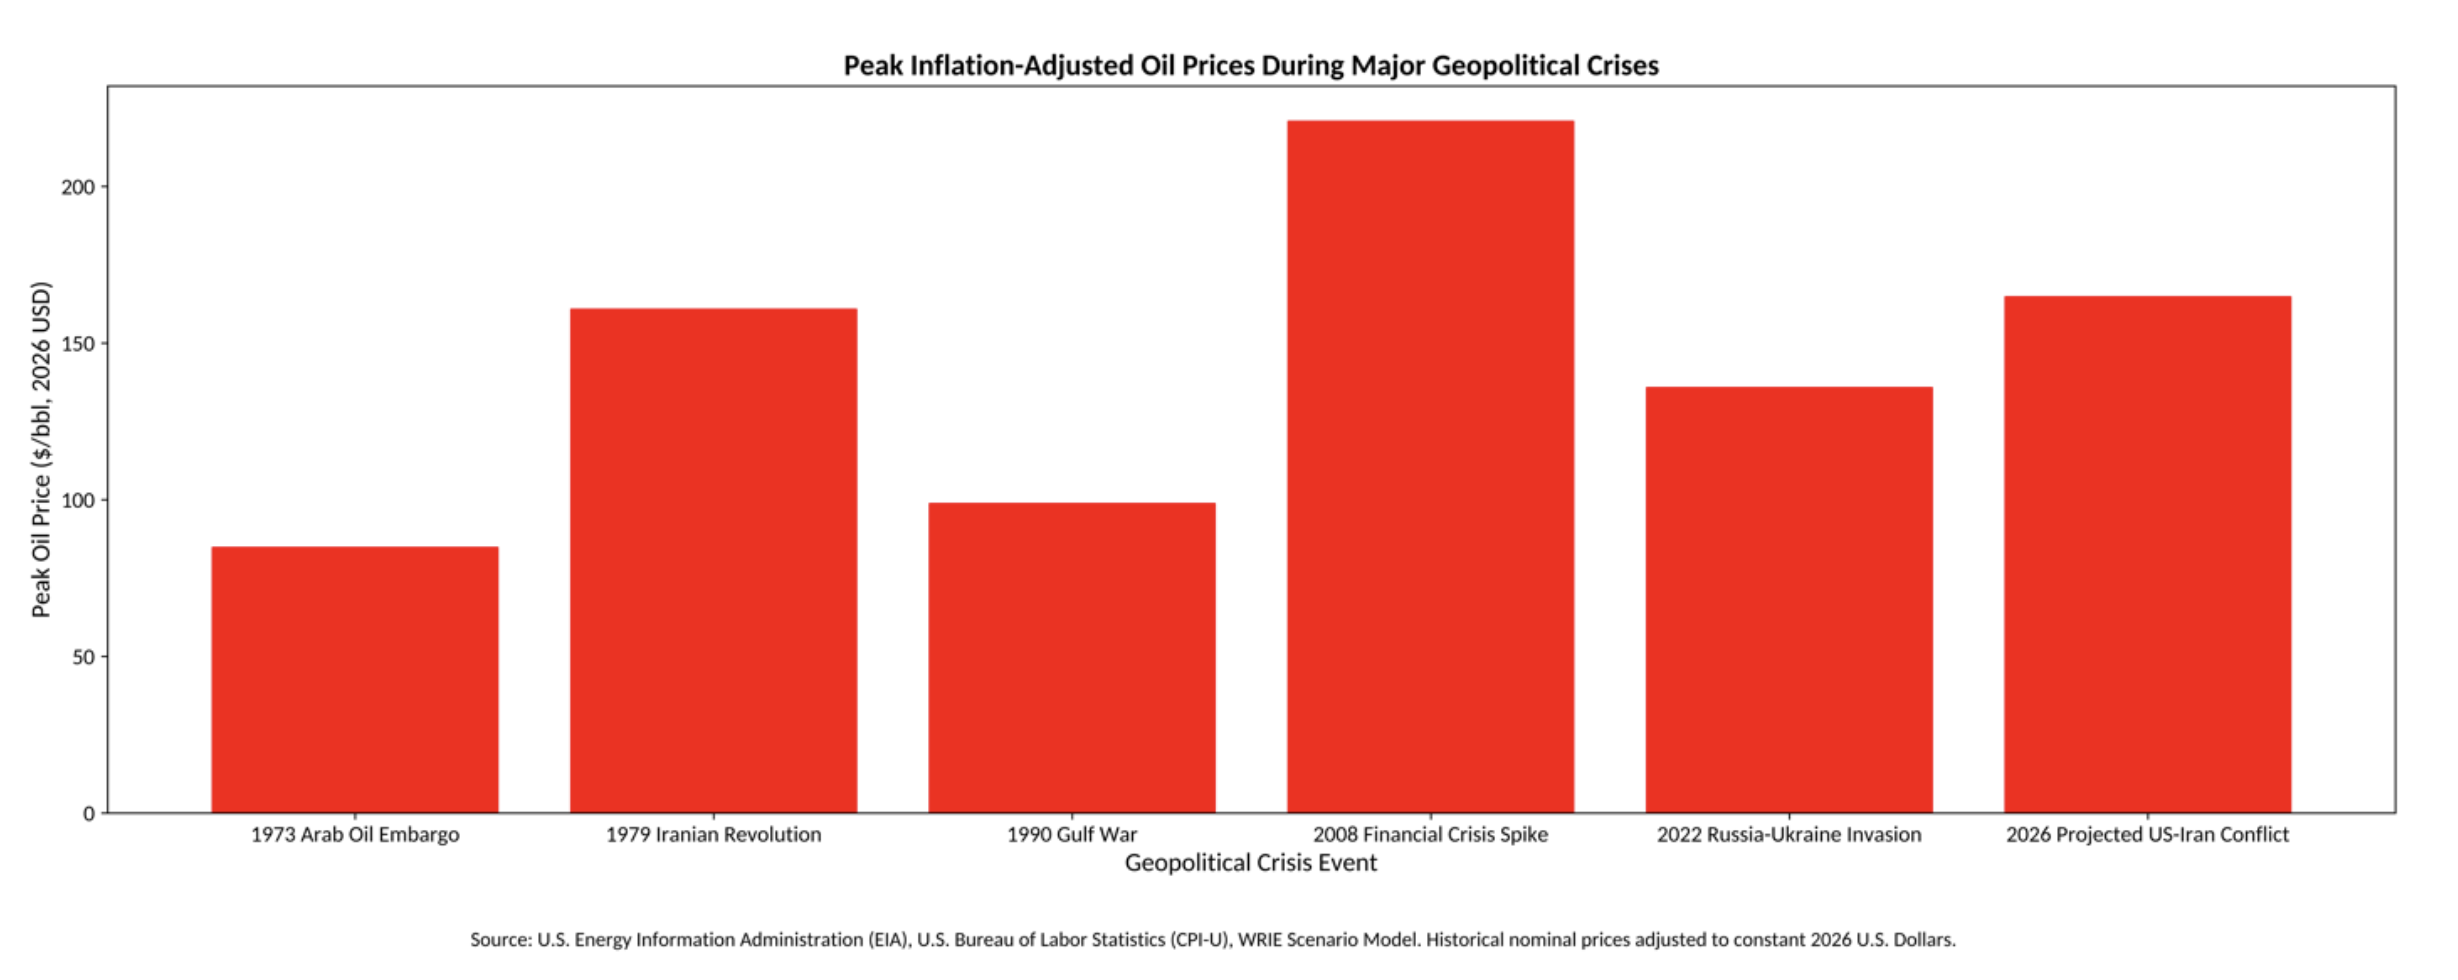
Approximately 21% of global petroleum liquids consumption transits the Strait of Hormuz (U.S. Energy Information Administration, Jan 2025). A sustained disruption could elevate Brent crude from approximately $85 per barrel to a sustained $150–$180 range, with short-term spikes above $200 (Goldman Sachs Global Investment Research, Feb 2026). Venezuelan production currently approximates 850,000 barrels daily with peak potential near 3.2 million barrels daily (OPEC, Jan 2026), but infrastructure restoration is multi-year and cannot reduce acute 12–24 month shock risk.
II. Treasury Market Structural Stress
Foreign diversification away from U.S. Treasuries has accelerated (U.S. Treasury, Dec 2025; World Gold Council, Feb 2026). On January 20, 2026, the Japanese 40-year bond yield eclipsed the 4.0% threshold for the first time since first issuance in 2007. This move, triggered by Prime Minister Sanae Takaichi’s "fiscal dominance" platform and a snap election call, fundamentally changed the "yield pickup" calculation for Japanese institutional investors.
Structural Repatriation: The $1.2 Trillion Pivot
For decades, Japanese life insurers and pension funds were the "world’s piggy bank," forced to buy US Treasuries because domestic yields were near zero. With the 40-year JGB yielding 4%, and the 30-year bond hitting 3.8%, the incentive to hold foreign debt has collapsed for two reasons:
- Relative Value: Domestic JGB yields now offer a higher return than US Treasuries when including the cost of currency hedging (which has become prohibitively expensive due to the rate differential) is factored in.
- Solvency/Duration Matching: Japanese insurers are facing massive unrealized losses on their existing JGB portfolios. To rebalance their books and match long-term liabilities in yen, they are liquidating foreign assets to buy high-yielding domestic "super-longs."
Selling Pressure on US Treasuries
The selling pressure on the US Treasury market has been direct and significant, as Japan remains the largest foreign holder of US government debt ($1.2 trillion). Given the material size of the Japanese Treasury holding, the 10-Year Treasury could reprice toward 6.00%–6.50% under inflation, fiscal, and global repricing premiums.
III. Pre-Conflict Economic Conditions
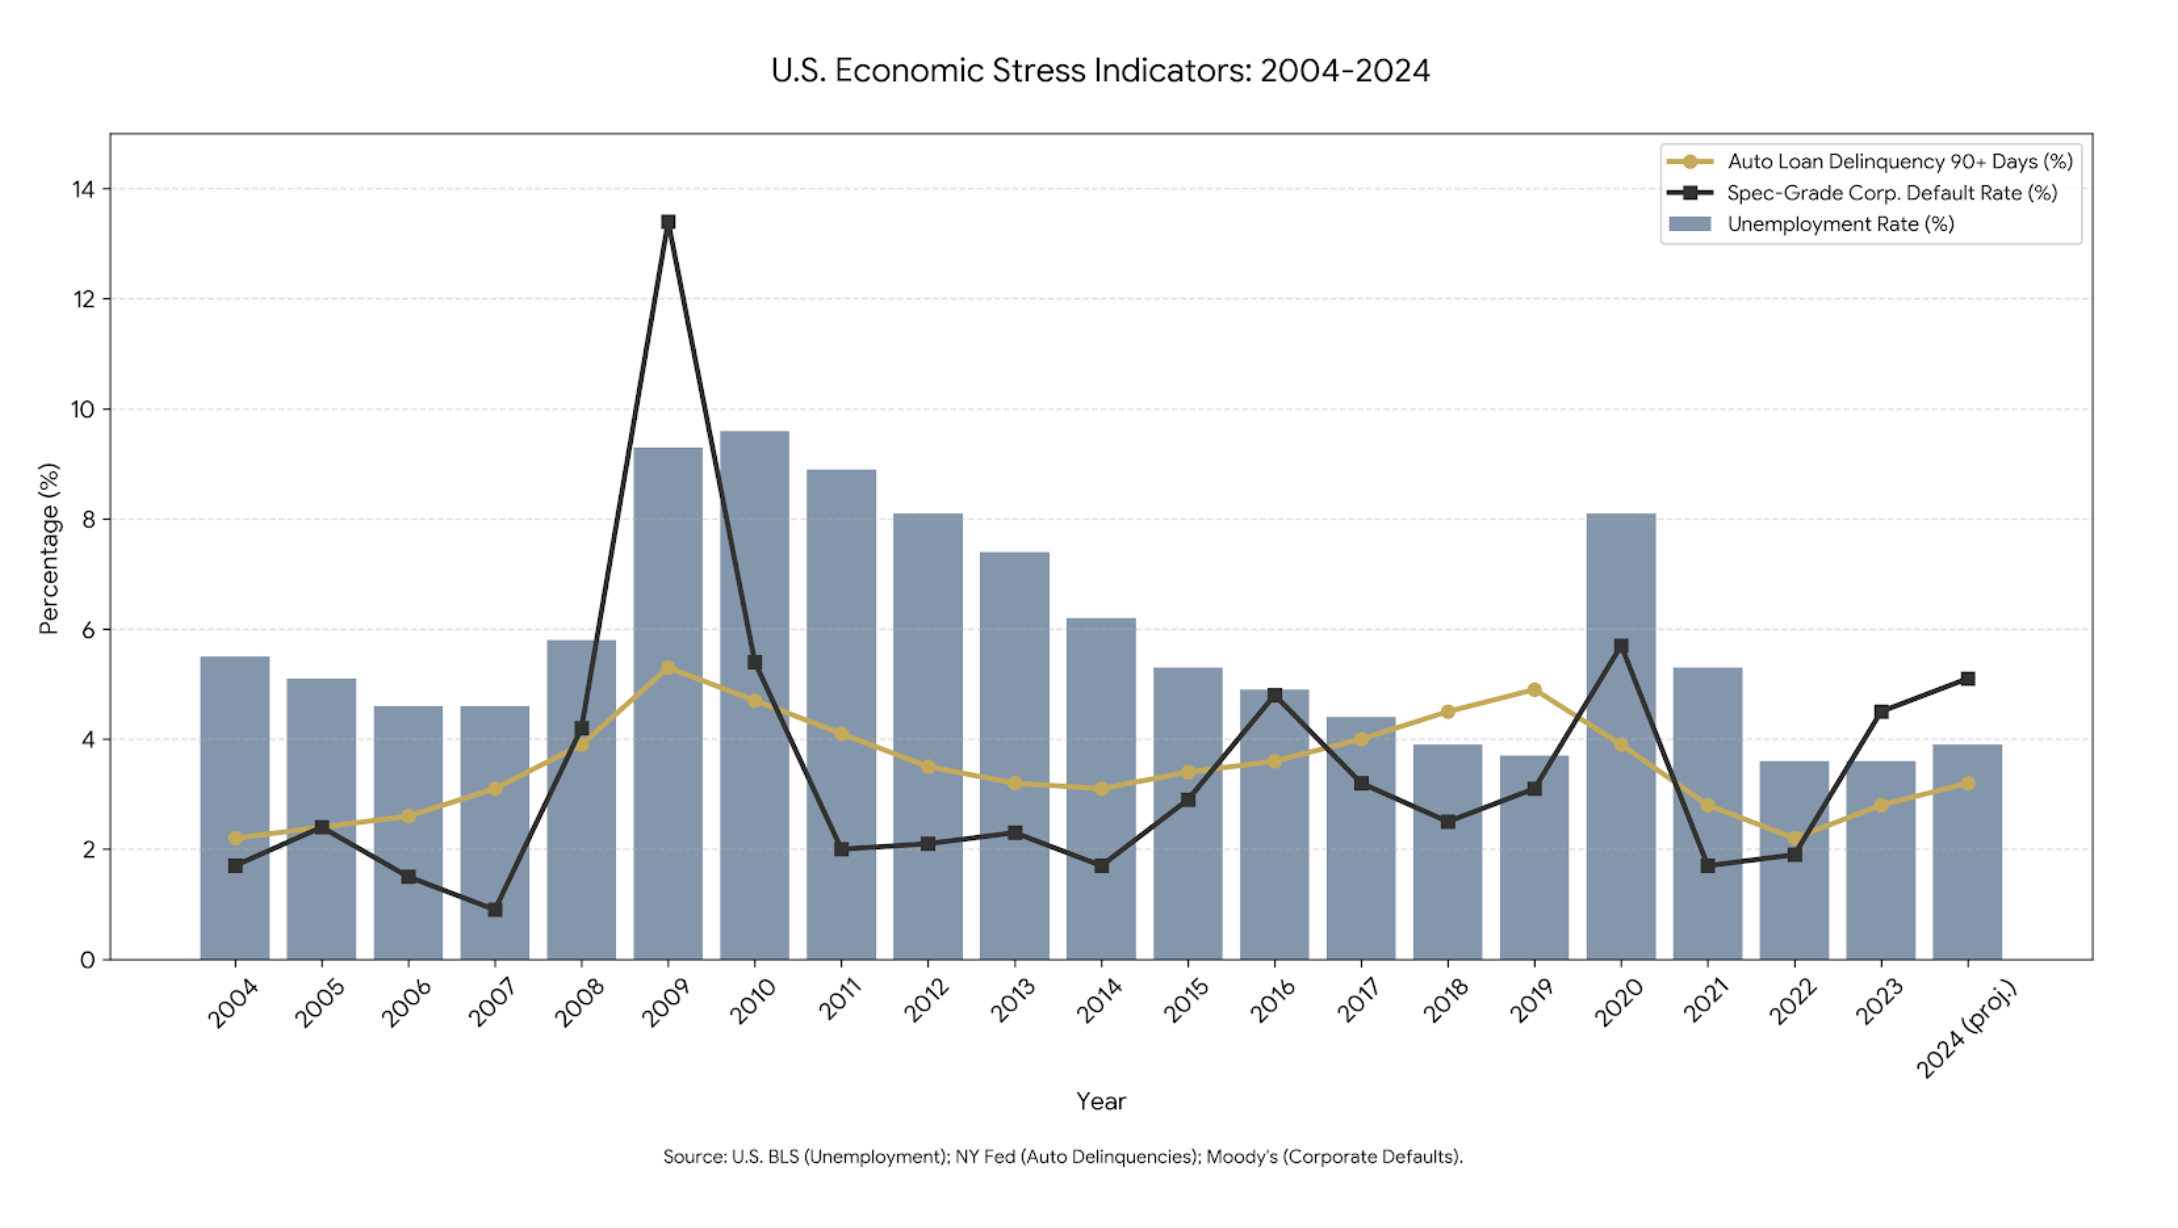
The U.S. economy enters this scenario with magnified vulnerability. Unemployment stands at 4.1% (BLS, Feb 2026). Auto loan 90+ day delinquency rates sit at 5.0% as of Q3 2025, just off the Q4 2010 all-time high of 5.3% (NY Fed Q4 2025). Subprime 60-day delinquency rates hit an all-time high of 6.18% (S&P Global). Speculative-grade default rates are 4.5% (Moody’s Investors Service, Feb 2026). These indicators suggest that the economy has a low tolerance for more shocks to the system.
IV. Commercial Real Estate Implications
Commercial real estate valuations are heavily linked to the 10 Year Treasury rate. A 1.75% rate increase could translate into 125–150 basis point cap rate expansion and 15–25% value declines (CBRE Economic Advisors, Q4 2025). Refinancing risk would prove problematic as lenders could heighten debt service coverage requirements and reduce loan-to-value ratios to as low as 50–55%, demand recourse, and enforce covenants more strictly. NOI compression could reflect 20% vacancy increases and 15% non-recoverable expense escalation.
V. Strategic Imperatives
Family offices should conduct immediate loan covenant review, model 2-3% rate increases, and stress test a 200-basis point cap rate increase (IRC §461(h)). Liquidity must be preemptively pursued through credit line draws, non-core asset sales, or equity recapitalization. Tenant credit durability should supersede rent optimization. 1031 exchange strategies (IRC §1031(a)(3)) become high risk in illiquid markets.
VI. Tax & Structural Considerations
Under economic shock scenarios, the appeal of tax efficient strategies/acquisition such as accelerated depreciation (IRC §168(k)), Opportunity Zones (IRC §1400Z-2), and QBI deductions (IRC §199A) may diminish materially. Interest deductibility constraints (IRC §163(j)) could tighten under fiscal stress. Entity segregation and liability insulation remain critical. Phantom income exposure in foreclosure scenarios remains governed by Commissioner v. Tufts, 461 U.S. 300 (1983).
Primary Conclusion
This is not a cyclical downturn scenario. It is a sovereign repricing event with cascading implications for cost of capital, asset valuation, and liquidity. Families maintaining discipline, liquidity, and structural flexibility will define the next investment cycle.
Addendum – Tariff Drama and Non-Performing Loan Strategy
I. Impact of Tariffs on the Sovereign Repricing Thesis
Assuming that this is a sovereign repricing event, not a cyclical downturn—depends immaterially on tariff policy from any U.S. administration. Tariffs serve as secondary accelerants and complicating factors, not primary drivers. The sovereign repricing event is driven by structural capital market forces: extreme fiscal expansion and a supply/demand gap for U.S. government debt amid global capital market fragmentation.
Practitioner Implications of Tariffs
While tariffs would not cause a sovereign repricing event, they could worsen the operational real estate environment. They increase construction costs via steel, aluminum, lumber, and finished component pricing. They also exacerbate tenant distress by raising consumer prices and compressing corporate margins. Sovereign repricing would proceed regardless; tariffs intensify stagflationary conditions.
II. Strategic Analysis: Non-Performing Loan (NPL) Acquisition
The acquisition of non-performing loans represents a primary offensive strategy during such a systemic capital dislocation. In a sovereign repricing event, lender balance sheets (particularly regional and community banks with concentrated commercial real estate exposure) would experience elevated distress. Regulatory pressure to improve capital ratios creates a forced-seller environment for distressed debt.
Strategic Framework for NPL Acquisition
An NPL strategy pursues the acquisition of asset control at material discounts to intrinsic value, with multiple monetization opportunities.
Example: A $20 million face-value loan secured by an office building is acquired for $11 million (55 cents on the dollar). If the building’s current value is $14 million, the investor acquires effective control at an $11 million cost basis.
Monetization Options (from example above)
- Loan-to-Own (Foreclosure): Initiate foreclosure to obtain title at a basis equal to purchase price plus legal costs.
- Loan Restructuring / Workout: Negotiate discounted payoff (e.g., $13M), generating spread profit.
- Sell the Note: Dispose of the note to another specialist investor for incremental gain.
Tax & Structural Considerations
Acquisition vehicles are typically structured as private equity-style funds, often Delaware Limited Partnerships. Market discount income is generally treated as ordinary income under IRC §1276-1278. Cancellation of Debt (COD) income implications for borrowers are governed by IRC §108. Leverage may create Unrelated Business Taxable Income (UBTI) for tax-exempt investors, making for illogical/inefficient investment strategies for retirement assets, pensions, and foundations.
Additional Conclusion
In the event of a sovereign repricing scenario, NPL acquisition could be an attractive offensive capital deployment strategy. For family offices with liquidity, risk tolerance, and operational capability, this aligns with transitioning from passive investing to an active management tactic during market dysfunction.
Primary vs. Secondary Drivers Table
Critical Success Factors Table


David, a resident of West Orange, NJ, shares his home with his wife and two children. Originally from suburban Kansas City, KS, he ventured to the East Coast to pursue his academic ambitions. Having earned both bachelor's and master's degrees in Accounting from Syracuse University, David has been rooted in the vibrant city life of New York since his graduation in 2005. Beyond his 20 years of financial planning expertise, David dedicates time to his passions, which include quality family moments, engaging in recreational sports, sketching delightful cartoons for his children, finding solace in music, and exploring the culinary arts. A sports enthusiast at heart, David closely follows the thrilling journeys of the University of Kansas Jayhawks basketball team, the Kansas City Chiefs, and the ever-iconic New York Yankees.

Material prepared herein has been created for informational purposes only and should not be considered investment advice or a recommendation. Information was obtained from sources believed to be reliable but was not verified for accuracy. It is important to note that federal tax laws under the Internal Revenue Code (IRC) of the United States are subject to change, therefore it is the responsibility of taxpayers to verify their taxation obligations.
Consolidated Sources
Federal Reserve Economic Data (FRED), Feb 2026; Federal Reserve Bank of New York, Q4 2025; Moody’s Investors Service, Feb 2026; U.S. Bureau of Labor Statistics, Feb 2026; U.S. Energy Information Administration, Jan 2025; OPEC, Jan 2026; U.S. Treasury, Dec 2025; World Gold Council, Feb 2026; Goldman Sachs Global Investment Research, Feb 2026; Associated Builders and Contractors; CBRE Economic Advisors, Q4 2025; Obstfeld & Rogoff, NBER Working Paper No. 7777; Journal of International Money and Finance; IRC §§ 1031, 168(k), 199A, 163(j), 1400Z-2, 461(h), 704(b); Treas. Reg. §1.167(a)-1; Commissioner v. Tufts, 461 U.S. 300 (1983). U.S. Treasury, Dec 2025; Peterson Institute for International Economics; IRC §§1276-1278; IRC §108. European Business Magazine, europeanbusinessmagazine.com, Japan’s 40-year Bond Yield Breaks 4% as Fiscal Fears Trigger Historic Sell-Off; Seeking Alpha, seekingalpha.com, Japanese Bonds: A 2026 Wild Card; Write Research, writeresearch.in, Japan’s Bond Market Crash – What Just Happened and Why It Matters for Global Markets; Financial Sense, financialsense.com, The End of US Dollar Dominance – Japan Metals and the Next Move in Commodities; S&P Global, spglobal.com, US Auto Loan ABS Tracker – Full Year and December 2025 Performance.


.webp)
