
Equities March Higher While The Fed Asserts Its Independence
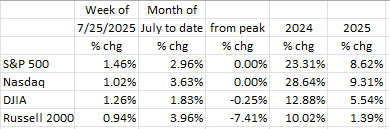
Once again, equities rose for the week (ended July 25th) with the S&P 500 up nearly 1.5%, the Nasdaq just over 1.0%, the Dow just under 1.3%, and even small cap stocks participated (Russell 2000 +0.9%).1 The month to date numbers are positive for each index in the +1.4% to +4.0% range. 2025 year to date appears to be favoring the tech heavy indexes (S&P 500 and Nasdaq) but not so much the old-time industrials (DJIA) or small caps (Russell 2000).
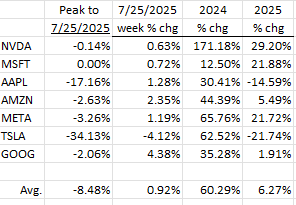
Six of the Magnificent 7 rose on the week with Tesla (TSLA -4.1%) the only laggard.2 Microsoft (MSFT) closed on Friday at a new record high and Nvidia posted a new high on Thursday (July 24th). It’s been quite a run for stocks since the April lows. Two stocks that don’t seem to be participating are Apple (AAPL) and Tesla (TSLA). Apple is off its high by more than -17% and Tesla twice that (-34%).2 And both are off double digits year to date. The table shows that three of the seven (NVDA, MSFT, and META) are up more than 20% this year. Amazon and Google are also up, but in the single digit range.2
Tariffs
Meanwhile, the White House has reached an agreement with Japan, setting tariffs on Japanese imports at 15%.1 Markets reacted positively to that news and now await word on negotiations with the European Union (EU), the results of which appear to be coming shortly. The economies in the EU are softening and the European Central Bank (ECB) has moved their policy rate to 2%, the mid-point of their neutral range. Unlike the ECB, the Fed’s current reference rate (the Fed Funds Rate), at 4.25% to 4.50%, is significantly above the Fed’s stated 2% neutral rate.3 The Fed appears to have some catching-up to do.
Fed Independence
We don’t have to review the political theater that has been playing out between President Trump and Fed Chair Powell as it’s been all over the news. The independence of the Fed from a sitting Administration was written into the 1913 law establishing the Fed.4 [Imagine the economic damage and resulting inflation if sitting U.S. Presidents controlled the Fed!] While President Trump has threatened to “fire” Chairman Powell several times for not lowering the Fed Funds Rate, it doesn’t appear that he has the authority to do so.4
The Fed’s Federal Open Market Committee (FOMC) whose next meeting is in the last week of July, is composed of 12 members. They are the seven members of the Board of Governors (nominated by the sitting President and confirmed by the Senate), the President of the NY Fed, and four of the eleven remaining Regional Federal Reserve Bank Presidents (on a rotating basis).5 Powell, while Chair and with a great deal of influence, is only one of the 12 votes on the FOMC. So even if Powell wanted to lower, it isn’t a slam dunk.
The Fed knows that it takes several months for its policy changes to have a significant economic impact. A good example is mortgage rates. A lower Fed Funds Rate would likely push mortgage rates down, but the impact on the economy is slow (mortgage by mortgage). As noted below, housing has become slow, so, it would behoove the Fed to lower rates. Thus, as emerging data show a slowing economy, it is only fitting that they lower the Fed Funds Rate.
But the Fed knows that its independence is of utmost importance. As a result, we expect the Fed to maintain the Fed Funds Rate where it is (4.25%-4.50%) at its late July meeting if for no other reason than to reassert its independence from the Administration. Markets agree. The Market’s odds of a rate decrease at the July meeting are a scant 2.6%.3
It is also clear that the President now realizes that he can’t force the Fed, that the Fed values its independence and will fight for it, and that if he wants lower interest rates, he will have to wait until the Fed’s September meeting (market odds of a September rate cut are 62%, as the market sees a softening economy making headline news at that time).3 Thus, it behooves the President to stop discussing monetary policy and lay off criticizing the Chairman. If that were to occur, and the Fed lowers in September, the economy would benefit.
Housing
New home sales rose +0.6% in June to a 627K annual rate.6 But that’s where the good news ends. The consensus expectation was 650K, and the small rise in June barely dented the huge -11.6% falloff in May. The combined May/June performance was the worst two-month performance since late 2022.
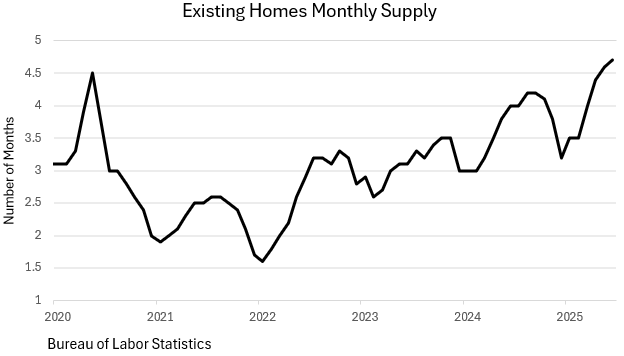
Inventory levels of those new, unsold, homes were at 9.8 months’ supply at existing sales rates, up from 8.5 months in April and 9.7 in May. As a result, the average price for new homes fell by -2.1% in June from May levels while the median price was off -4.9% from May and down -3.0% from a year ago. Things were no better in the existing home space. Home prices fell -2.7% in June from May levels and existing home sales are now below the levels that occurred at the beginning of the last three Recessions. So, this is a Big Deal! The months’ supply, at current sales rates, has risen from 3.5 months in February to 4.7 months currently, and Zillow reports that 25% of its listings reduced their asking price in June, the highest level for a June month since 2018.
It is hard to not conclude that deflation is in the immediate future for residential real estate. Of greater concern here is that the value of that personal residence is the major asset for the vast majority of U.S. households, and lower values will impact future consumption via the “wealth effect,” i.e., consumers spend more/less when their net worth rises/falls.
Other Indicators
The Conference Board’s Leading Economic Indicators (LEI) fell again in June (-0.3%), are down -4% from a year ago, and have been constantly negative for the past three years.7 While some may say these measures are obsolete, we still believe that they impart value to the overall economic picture. Currently, this index is at a ten-year low. It peaked in December 2021 and is down -17.8% since.
The Philadelphia Fed’s Non-Manufacturing Index came in at -10.3 for July (somewhat better than June’s -25.0, but still negative).8 It has been negative for nine months in a row, and its expectations index for six months hence, at -3.9, has also been negative for six months in a row.
The Richmond Fed’s Manufacturing Index fell to -20 in July from -8 in June. Market expectations were for a -2 reading.9 And the Chicago Fed’s National Activity index (a model with 85 variables) showed up at -0.1 in June, negative now for three months in a row.
Companies employing 100 or more must notify workers 60 days prior to layoffs. This is called Worker Adjustment and Retraining Notification (WARN). Such notifications are up +23% over the past year. This means that weakness will be showing up in the employment data as the year progresses.
Final Thoughts
Equity markets continue to march higher despite growing evidence of a slowing economy. Housing sales, both from new construction and from existing units have slowed precipitously and clearly need lower mortgage rates. Such rates are tied to the 10 Year Treasury yield.
Other indicators show slippage in the economy. The Conference Board’s LEI, the Philly Fed’s Non-Manufacturing Index, the Richmond Fed’s Manufacturing Index, and the Chicago Fed’s National Activity Index have all been negative for several months. And higher layoffs appear to be just around the corner.
Under normal circumstances, the Fed would be moving smoothly toward ease. But these aren’t “normal” times. Recent pressure by the White House on Chairman Powell has put the Fed’s independence in question and at risk. And, while the President has recently backed off, to put an exclamation point on the Fed’s independence, even at the risk of raising the odds of a Recession, it is highly likely that the Fed will not move rates lower at their late July meeting. The market’s odds of a July rate decrease recently fell to 2.6%!3 The next Fed meeting is in September. If the economy really deteriorates, there could be an inter-meeting move lower for the Fed Funds Rate, but that’s highly unlikely. So, as things now stand, the Fed’s next rate reduction will likely occur in September. Stay tuned.


Dr. Robert Barone, Ph.D. is an economist whose storied career spans numerous decades and positions within the world of finance. Since gaining his Ph.D. in Economics from Georgetown, he has been a Professor of Finance (University of Nevada), a community bank CEO (Comstock Bancorp), and a Director of the Federal Home Loan Bank of San Francisco, where he served as its Chair in 2004. He lives and breathes the world of finance, continuing to provide clients and avid Forbes readers with his latest market insights.

(Joshua Barone and Eugene Hoover contributed to this blog.)
Robert Barone, Joshua Barone and Eugene Hoover are investment adviser representatives with Savvy Advisors, Inc. (“Savvy Advisors”). Savvy Advisors is an SEC registered investment advisor. Material prepared herein has been created for informational purposes only and should not be considered investment advice or a recommendation. Information was obtained from sources believed to be reliable but was not verified for accuracy.
Ancora West Advisors, LLC dba Universal Value Advisors (“UVA”) is an investment advisor firm registered with the Securities and Exchange Commission. Savvy Advisors, Inc. (“Savvy Advisors”) is also an investment advisor firm registered with the SEC. UVA and Savvy are not affiliated or related.
Reference:
1: T. Rowe Price. (2025). Weekly Market Recap: July 25, 2025.
2: Investopedia. (2025). Magnificent Seven Stocks: Performance Update.
3: Investing.com. (2025). Fed Rate Decision Preview: July 29-30, 2025.
4: CBS News. (2025). Trump’s Threats Against Fed Chair Powell: Legal Limits.
5: Federal Reserve. (2025). Structure of the Federal Open Market Committee.
6 Yahoo Finance. (2025) US new home sales below expectations in June; housing supply rises
7 The Conference Board (2025) The Conference Board Leading Economic Index® (LEI) for the US Declined in June
8 FRB PHL (2025) Nonmanufacturing Business Outlook Survey
9 TipRanks (2025) Richmond Fed Index Plummets: Market Faces Uncertainty x
