
Hyperscalers vs. Telcos: A Capital Cycle Analysis of the AI Infrastructure Market
Abstract
A historic capital expenditure boom in Artificial Intelligence (AI) infrastructure is creating the preconditions for a margin-crushing price war among the world's largest technology companies. This analysis demonstrates that the current investment cycle, driven by hyperscale cloud providers and Meta Platforms, mirrors past infrastructure build-outs — notably in telecommunications — that ultimately led to commoditization, overcapacity, and diminished returns for the infrastructure builders. Based on reported Q1 2026 earnings and full-year guidance, the combined 2026 capital expenditure plans of Amazon, Microsoft, Google, and Meta have been revised upward to approximately $725 billion — a 77% increase over the group's combined $410 billion in 2025. This represents the largest single-year, concentrated infrastructure investment cycle in the history of technology, a scale that structurally alters market dynamics by creating a high probability of future supply exceeding economically viable demand.
This report applies capital cycle theory to argue that the AI infrastructure market is predisposed to this outcome. A confluence of three economic factors creates powerful, systemic pressure toward price-based competition: (1) extremely high fixed costs, dominated by GPUs and data center construction; (2) near-zero marginal costs for serving an additional AI query; and (3) an increasingly fungible product in the form of raw compute power. While the AI market is nascent and hardware depreciation cycles are faster than in historical analogues, these distinguishing factors appear to accelerate, rather than negate, the fundamental economic trajectory toward commoditization. The primary near-term beneficiaries of this cycle are chipmakers like NVIDIA, but their position is structurally exposed to the cycle's eventual and inevitable turn.
For the hyperscalers — Amazon, Microsoft, and Google — the strategic endgame is likely not to operate AI infrastructure as a perpetually high-margin business. Instead, it is to deploy it as a utility to defend and extend their core quasi-monopolies in e-commerce, enterprise software, and digital advertising. This analysis provides investors with a tiered dashboard of eight specific, observable signals to monitor. These signals, ranging from capital expenditure growth rates to cloud-segment margins, can serve as early warnings of the cycle's inflection point. The core conclusion is that economic value will likely migrate from the infrastructure layer to the application layer, rewarding companies that leverage cheap, abundant AI to create novel products and services that were previously economically unfeasible.
Theoretical Foundations: Capital Cycle Theory
The analytical lens for this report is capital cycle theory, a framework for investment analysis popularized by Marathon Asset Management. Its central premise is that the prospect of high returns attracts capital investment, leading to an expansion of industry capacity. This new capacity, in turn, increases competition, which eventually drives down returns, discourages further investment, and leads to industry consolidation. The cycle then resets. This framework is particularly potent for analyzing industries with the following structural characteristics, all of which are deeply resonant with the AI infrastructure market:
· High capital intensity: Industries where massive, lumpy upfront investment is required to participate, creating high barriers to entry but also high exit costs.
· Near-zero marginal cost: Once the fixed infrastructure is built, the cost of serving one additional customer is negligible, creating a powerful incentive to cut prices to fill capacity.
· Product fungibility: When customers perceive competing providers' offerings as interchangeable, pricing power erodes and the competitive battleground shifts entirely to cost.
· Competitive prisoner's dilemma: When all participants feel compelled to invest simultaneously — fearing that failure to do so will cede a decisive advantage to rivals — the result is rational individual behavior producing irrational collective overcapacity.
This report posits that the AI infrastructure sector exhibits all four of these characteristics in an extreme form. The capital being deployed is immense, the marginal cost of an API call is near zero, compute is increasingly fungible (though with nuances discussed later), and the competitive prisoner's dilemma is forcing all players to invest simultaneously, creating a high probability of future overcapacity. This theoretical foundation provides a structured, non-narrative-based approach to forecasting the long-term evolution of profitability in the AI value chain.
Methodology
This analysis employs a qualitative, model-driven framework grounded in capital cycle theory and supported by publicly available financial data, industry reports, and historical analogues. The objective is to provide a structured, evidence-based forecast of the AI infrastructure market's competitive evolution. The methodology comprises four distinct components:
1. Quantitative CapEx Modeling: A bottom-up compilation of 2026 capital expenditure guidance for the four primary hyperscalers, derived from Q1 2026 earnings releases and management guidance issued April 29, 2026.
2. Historical Analogue Analysis: A comparative study of capital cycle dynamics in the telecommunications (4G/5G build-out and fiber optic boom/bust) industries to identify structural parallels and differences.
3. Value Chain Phase Analysis: A framework for mapping the sequence of value capture and value destruction across the AI ecosystem, identifying which players are positioned to win or lose at each phase of the cycle.
4. Inflection Signal Dashboard: A tiered set of eight observable, publicly reportable metrics that investors can monitor to identify when the cycle transitions from build-out to commoditization.
1. The State of Play: A Record Capital Expenditure Cycle
The technology market since 2023 has been defined by a capital spending arms race to build the foundational infrastructure for artificial intelligence. The primary actors — Amazon (AWS), Microsoft (Azure), Google (GCP), and Meta — are engaged in a competitive rush to acquire the computational power necessary to train and operate advanced AI models. This is not a typical investment cycle; its scale and velocity represent a structural reshaping of the internet's core fabric, driven by a competitive dynamic where each participant must invest aggressively to avoid being left behind.
Following Q1 2026 earnings reports released on April 29, 2026, the Financial Times compiled the four companies' full-year 2026 guidance, arriving at a combined figure of approximately $725 billion — a 77% increase over their combined $410 billion in 2025. This supersedes earlier pre-earnings estimates, which had placed the upper bound at roughly $670 billion. The individual company figures are as follows:

Several observations stand out from these figures. First, the 2025 actuals — $357 billion combined — already dwarfed the pre-earnings estimates that had anchored prior analyses at $175 billion. The acceleration from $217 billion in 2024 to $357 billion in 2025 (+65%) reflects the first full year of AI-driven infrastructure buildout. Second, the 2026 guidance step-up (+~100%) from 2025 actuals is extraordinary in absolute terms: a single year of incremental CapEx growth of roughly $350–370 billion. Third, Q1 2026 alone produced $134 billion in combined CapEx — equivalent to the entire combined annual CapEx of these four firms as recently as 2022.
A single large-scale AI data center can demand over 100 megawatts (MW) of power, equivalent to a small city, placing severe strain on regional utility grids in hubs like Northern Virginia and Atlanta (JLL, H1 2026 Data Center Outlook). This has ignited a secondary boom for utilities and industrial suppliers. It also underscores the immense, fixed, and geographically-concentrated nature of the investment — a classic feature of infrastructure prone to capital cycles and the risk of creating stranded assets.
1.1. Deconstructing the CapEx: Beyond the GPU
The headline CapEx figures, while staggering, mask a more complex underlying cost structure. The capital is not solely allocated to GPUs. A granular analysis reveals a multi-layered expenditure profile for building a modern "AI factory." Notably, both Microsoft and Meta cited elevated component costs — including GPU memory and advanced packaging — as a primary driver of their upward guidance revisions in Q1 2026 earnings commentary. The following breakdown is based on a model synthesized from public sources, including vendor pricing, industry conference presentations, and hyperscaler infrastructure cost analyses.
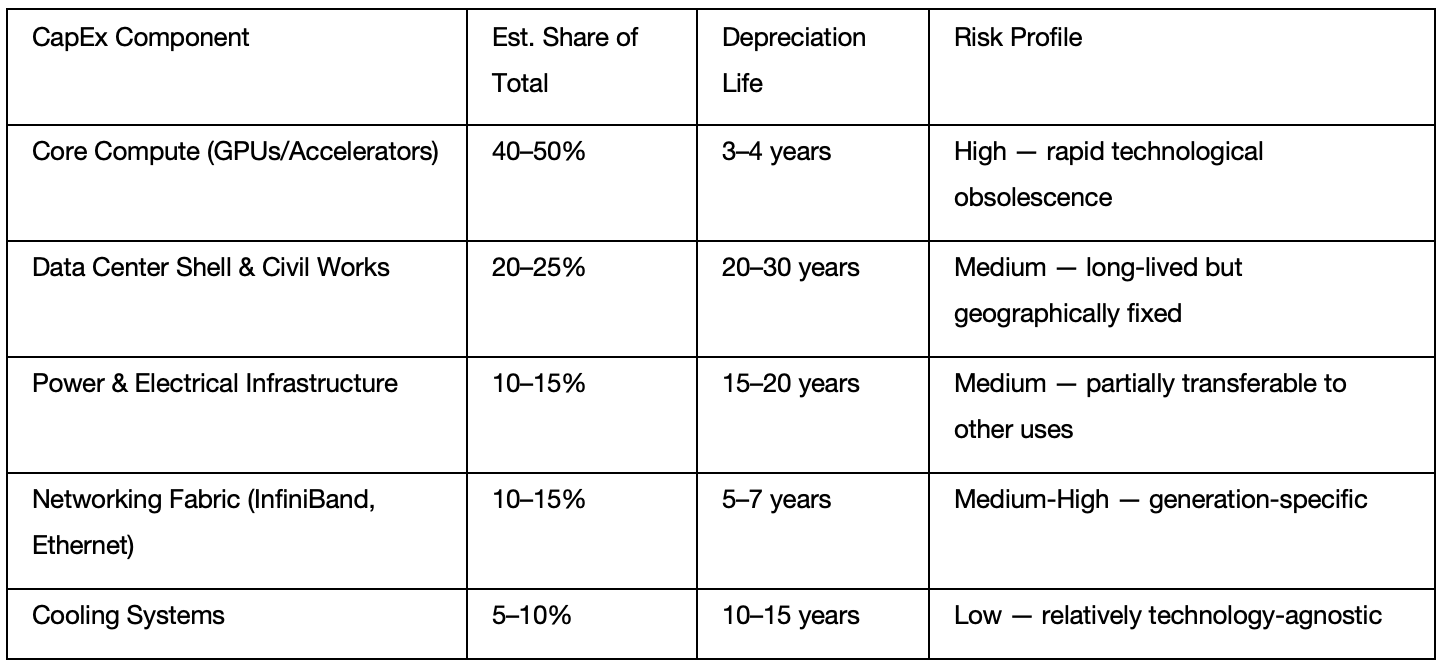
The critical observation from this breakdown is that the asset with the highest allocation (GPUs) also carries the shortest economic life. This creates the "depreciation treadmill" analyzed in detail in Section 3.
2. The Historical Analogues: Telecom's Cautionary Tales
To project the trajectory of the AI infrastructure market, historical analogues are more instructive than simple linear extrapolation. The build-outs of the telecom industry offer powerful case studies in how capital cycles in high-fixed-cost, low-marginal-cost industries typically resolve.
Case Study 1: The 4G/5G Wireless Build-Out. U.S. wireless carriers invested over $300 billion in cumulative capital from 2010 to 2020 to establish nationwide high-speed networks, according to data from industry association CTIA (CTIA, 2021 Annual Survey). The cycle proceeded in three distinct phases. First was the investment phase, where carriers competed on network coverage and speed. Second was the parity phase, where the user experience across major carriers became largely indistinguishable; all networks were "fast enough" for video streaming. This led directly to the third phase: commoditization. With network quality no longer a primary differentiator, competition shifted aggressively to price. The industry's high-fixed-cost, low-marginal-cost structure incentivized aggressive price cutting (e.g., the proliferation of "unlimited" data plans). Analysis of industry-wide data from carrier regulatory filings indicates that the compound annual growth rate for postpaid phone ARPU remained below 1% in nominal terms during the latter half of the decade, despite massive network investment. The ultimate financial beneficiaries were not the network builders, but application companies like Netflix, Uber, and Google that leveraged cheap, abundant bandwidth to create new services and business models.
Case Study 2: The Dot-Com Fiber Optic Bust. A more severe warning comes from the 2000–2002 fiber optic bubble. Driven by a belief in infinite demand for internet bandwidth, companies like Global Crossing and WorldCom collectively spent over $100 billion laying a global fiber network. The result was catastrophic oversupply. By 2001, up to 95% of newly laid long-haul fiber was "dark," an unused, non-revenue-generating asset (Odlyzko, 2001). Bandwidth prices collapsed by over 90%, triggering a wave of bankruptcies. The time from peak capital deployment in 1999–2000 to the start of the price collapse was less than 24 months. Yet, the physical infrastructure remained. This glut of cheap bandwidth became the foundational substrate for Google and YouTube, whose business models were predicated on the assumption of nearly free data transport — a direct consequence of the preceding capital cycle bust.
2.1. Distinguishing Hyperscaler and Telco Business Models
While the capital cycle dynamics are analogous, the strategic positioning of hyperscalers versus telcos reveals a critical distinction that reinforces the thesis. Telcos historically operated as "dumb pipes," providing connectivity but largely failing to capture value from the services running over their networks. Their attempts to move "up the stack" into content and applications — Verizon's acquisition of AOL and Yahoo, AT&T's acquisition of Time Warner — were strategically incoherent and resulted in massive write-downs and divestitures. They lacked the core competency in software and user experience to compete with digital natives.
Hyperscalers, in contrast, are masters of vertical integration. They control the infrastructure (cloud), the platform (operating systems, developer tools), and the end-user applications (Search, Office 365, e-commerce). This integration, however, does not make them immune to the capital cycle; it merely changes their strategic calculus. Their willingness to subsidize the infrastructure layer to protect and extend their highly profitable application-layer monopolies is precisely the mechanism that will accelerate commoditization of AI compute. The telcos' failure to integrate demonstrates the difficulty of capturing value upstream; the hyperscalers' success at it provides the motive for accepting utility-like returns on the underlying infrastructure. This distinction — motive, not immunity — is the key analytical insight separating the current cycle from its telecom precedents.
3. Applying the Framework to AI: Parallels and Distinctions
The assertion that AI infrastructure will follow the telecom playbook rests on identifying core structural parallels, while acknowledging critical differences that affect the cycle's timing and severity.
Structural Parallels
The economic DNA of the telecom and airline cycles is present in the AI build-out. Hyperscalers are spending hundreds of billions on GPUs, just as telcos spent billions on spectrum and towers. While AI applications are novel, the underlying resource — a petaflop of compute or a million-token API call — is rapidly becoming a standardized commodity sold by AWS, Azure, and GCP. The cost structure is identical: a massive upfront fixed investment in a depreciating asset fleet, with a near-zero marginal cost to run one more query. This creates a powerful incentive to price services down toward marginal cost to maximize utilization, a dynamic already proven by the price history of cloud storage.
For example, the list price for Amazon S3's standard storage tier in its US-East-1 region has declined by over 85% since its 2006 launch, from $0.15 per GB/month to under $0.023 per GB/month. When factoring in lower-cost tiers like Infrequent Access and Glacier Deep Archive, the effective cost reduction for long-term data archival approaches 99%. This serves as a powerful precedent for commoditization within the cloud ecosystem itself. Finally, the investment is driven by a competitive prisoner's dilemma; each hyperscaler must invest heavily to prevent rivals from gaining a decisive lead, a dynamic that raises the probability that capital will be deployed until capacity far exceeds immediate, profitable demand.
Critical Distinctions and Counterarguments
While the historical analogues are instructive, they are not a perfect map. Several key factors differentiate the current AI cycle and must be integrated into the analysis. These factors primarily influence the speed and shape of the cycle, not its fundamental direction.
1. Counterargument: Demand Is Exponential and Will Absorb All Supply
The most common rebuttal to the overcapacity thesis is that demand for AI is effectively infinite. While demand is currently growing at a historic rate, this argument is insufficient for three structural reasons:
· Demand is not monolithic. Current demand is heavily concentrated in a small number of high-value use cases (large model training, frontier inference). The mass-market, high-volume use cases that would be required to absorb commodity compute at scale have not yet been proven economically viable.
· Demand growth is not guaranteed to outpace supply growth. The supply of AI compute is being expanded by four of the world's most capital-rich companies simultaneously. There is no historical precedent for this level of coordinated, parallel investment in a single infrastructure category.
· Demand is price-elastic in a self-defeating way. The very price cuts needed to drive demand growth will compress the margins that justified the initial investment.
2. The Depreciation Headwind: An Accelerated Cycle
The rapid depreciation of AI hardware is arguably the single most important factor accelerating the capital cycle. While a telecom tower or fiber optic cable is depreciated over 15–25 years, an AI accelerator has a useful economic life of just 3–4 years before it is rendered functionally obsolete by a successor with a superior price-to-performance ratio.
At the revised scale of $725 billion in combined 2026 CapEx, the depreciation implications are severe. Assuming approximately 45% of total CapEx is allocated to AI accelerators (the most rapidly depreciating component), this equates to roughly $326 billion in GPU/accelerator investment in a single year. Depreciated straight-line over 4 years, this single year's hardware investment alone adds approximately $81 billion in annual depreciation expense to the industry's collective income statements — roughly $20 billion per company per year from 2026 spend alone. This is the "depreciation treadmill": to maintain stable operating margins, the gross profit from new AI services must grow at a rate fast enough to offset this massive, escalating fixed cost base every single year.
If a cloud division operates at a 30% operating margin, it needs to generate over $270 billion in new, high-margin revenue simply to offset the new annual depreciation charge from the industry's 2026 hardware investment alone. This illustrates the sheer scale of new commercial activity required merely to stand still on a profitability basis — and provides the most powerful structural argument that competitive pricing pressure is not a distant risk, but an imminent one.
3. Counterargument: Vertical Integration Creates Sustainable Differentiation
A key distinction from historical analogues is that hyperscalers are vertically integrated, controlling the infrastructure, key models (e.g., Google's Gemini, Microsoft-backed OpenAI models), and end-user applications. While this integration provides a strategic advantage, it does not negate the capital cycle dynamics for two reasons.
First, vertical integration provides the motive to commoditize the infrastructure layer, not the ability to avoid it. Evidence for this "utility" view of AI infrastructure comes directly from management commentary: Microsoft executives consistently frame Copilot as a way to "increase the value of Microsoft 365" and defend their enterprise software dominance; Google integrates Gemini into Search to protect its advertising franchise from disruptive new interfaces; Amazon uses AI to optimize logistics and enhance its retail marketplace. This bundling is an implicit admission that raw AI compute is a commodity whose cost can be subsidized by another profit center.
Second, this rational choice structurally leads to lower margins at the infrastructure layer itself. If the market begins to value the cloud infrastructure business less like a high-margin software company and more like a capital-intensive utility, its valuation multiple could compress, even if absolute revenue grows. This potential re-rating is a primary risk for investors.
4. The Erosion of Proprietary Moats and Fungibility
The final counterargument posits that AI compute is not fungible due to powerful proprietary ecosystems, chief among them NVIDIA's CUDA software stack, and tight integration between hyperscalers and their flagship models. While these ecosystems create real switching costs, they are being systematically eroded by four forces:
· Open-source model proliferation: The release of competitive open-source models (Meta's LLaMA series, Mistral, and others) decouples model capability from any single cloud provider.
· Custom silicon development: All three major hyperscalers (Google's TPUs, Amazon's Trainium/Inferentia, Microsoft's Maia) are developing proprietary accelerators as CUDA alternatives. Notably, Google began selling TPU access directly to cloud clients in Q1 2026 — a signal that custom silicon is reaching commercial maturity.
· Abstraction layers and portability tools: Growing adoption of inference frameworks (ONNX, OpenXLA) and multi-cloud orchestration tools reduces effective switching costs between cloud providers.
· Regulatory and enterprise procurement pressure: Large enterprise customers are increasingly demanding multi-cloud architectures and contractual portability to avoid vendor lock-in, directly compressing the moat value of proprietary ecosystems.
4. Analyzing the Ecosystem: A Phased Shift in Value
The capital cycle framework predicts a sequence of value capture, with different players winning at different times. Investors must identify which phase the market is in to position themselves effectively.
Phase 1 Winners: The "Arms Dealers" (Chipmakers)
In the current AI gold rush, chipmakers like NVIDIA are selling the "picks and shovels," making them the primary front-end beneficiaries. Their dominant market position allows for premium pricing and extraordinary gross margins. Their position, however, is exposed to three structural risks inherent to the capital cycle:
· Hyperscaler custom silicon: All major hyperscalers are investing billions to develop in-house AI accelerators. As these achieve performance parity, they will substitute for NVIDIA GPUs in the highest-volume workloads — specifically large-scale inference — compressing NVIDIA's total addressable market.
· CapEx cycle deceleration: NVIDIA's revenue is a derivative of hyperscaler CapEx growth. When CapEx growth decelerates (Signal 1 in Section 5), NVIDIA's revenue growth will decelerate faster, given the lag between order placement, production, and revenue recognition.
· Competitive GPU entrants: AMD, Intel Gaudi, and a growing field of AI chip startups are narrowing the performance gap, providing hyperscalers with negotiating leverage and a credible alternative to NVIDIA's premium pricing.
Intermediate Beneficiaries: Second-Wave Value Capture
The CapEx boom supports a wide range of secondary players whose fortunes are tightly correlated with the hyperscalers' spending:
· Power and utilities: Data center power demand growth is a multi-year, contracted tailwind largely insulated from AI application layer volatility.
· Data center REITs and colocation providers: Benefiting from hyperscaler demand for pre-built, powered shells on an accelerated timeline.
· Networking infrastructure vendors: Companies supplying high-bandwidth, low-latency interconnect fabric (InfiniBand switches, optical transceivers) required for GPU cluster operation.
· Industrial construction and cooling: Building and outfitting data centers at this scale requires specialized engineering and represents a multi-year backlog business.
These players represent the "infrastructure picks and shovels" one layer below the chip. Their investment cycle risk is correlated with, but slightly lagged behind, the chip cycle.
Phase 2 Casualties: The "Network Builders" (Hyperscalers)
As hundreds of billions in CapEx become operational, the supply of AI compute will swell, making a price war highly probable within a 3–5 year horizon. The competitive basis will shift from "Do you have GPU capacity?" to "How much does your API call cost?" The combination of a fungible product and a prisoner's dilemma among rational competitors — where any one player has an incentive to cut prices to fill capacity — makes sustained, supernormal profits structurally untenable.
This points to a risk of long-term cloud margins facing downward pressure from their current levels — which range from the low-20s for Google Cloud to peak levels over 30% for AWS — toward a structural benchmark set by other capital-intensive industrial or utility businesses, which historically operate in the 15–20% range (FactSet, 2025). This is not a deterministic forecast, but an indication of the direction of economic gravity.
Defining the Application Layer Winners: Where Value Will Settle
The thesis that "value migrates up the stack" requires a precise definition of the winning application-layer companies. The winners will not be companies that simply use an AI API to add a superficial feature. The durable value will accrue to businesses where cheap, abundant AI compute enables a fundamentally new product, service, or business model that was previously impossible or economically unviable. Three archetypes of these long-term winners are emerging:
Archetype 1: The "Autonomous Agent" Businesses (AI-Native Labor Substitutes). These are companies that deploy AI to perform high-value knowledge work tasks at a fraction of human labor cost — legal document review, financial audit, software code generation, clinical trial data analysis. The business model charges per completed outcome (a reviewed contract, a filed audit, a deployed feature), not per compute token consumed. Their competitive moat is not the AI model itself but the workflow integration, liability absorption, domain-specific fine-tuning data, and enterprise change management capability they provide. As GPU prices fall, their margins expand without requiring a price reduction to end customers.
Archetype 2: The "Data Flywheel" Businesses (Proprietary Data Moat Holders). These are companies whose core asset is a proprietary, continuously updated, and structurally inaccessible dataset that cannot be replicated by a competitor who simply purchases more compute — exclusive access to real-world interaction data, clinical outcomes databases, financial transaction flows. As the cost of model training and inference falls, the value of the proprietary data asset is enhanced, not eroded. These businesses benefit from the capital cycle bust by getting access to cheaper infrastructure to exploit their moat.
Archetype 3: The "Previously Uneconomic" Businesses (New Business Model Enablers). These are companies whose business model was economically unviable before cheap, abundant AI compute, analogous to how YouTube was unviable before cheap bandwidth or Uber before the smartphone. They are creating genuinely new markets rather than displacing existing ones. Identifying these companies early requires evaluating whether their core value proposition depends on AI being abundant and cheap, or whether AI is merely an incremental efficiency improvement. The former represents structural value; the latter represents a feature.
Investor Screening Criteria: To identify potential application-layer winners, screen for: (1) High and defensible gross margins (>60%), indicating compute is a small, manageable fraction of COGS. (2) An outcome-based pricing model (per-audit, per-design, per-mile), not per API call — this insulates margin from compute price deflation. (3) Evidence of significant investment in proprietary data acquisition and curation, which serves as the true competitive moat. (4) A revenue base that accelerates as AI becomes cheaper, not one that competes directly with AI providers on price.
5. A Dashboard of Inflection Point Signals
To translate theory into a practical tool, this section presents a tiered dashboard of eight specific, observable signals. Monitoring these metrics can provide an early warning that the AI capital cycle is approaching an inflection point, shifting from the build-out phase to a period of price competition and margin pressure.
Primary Inflection Warnings (Highest Predictive Value)
Signal 1: Decelerating Hyperscaler CapEx Growth Rate (Year-over-Year)
What to watch: A deceleration from the current ~77% YoY CapEx growth rate to single digits, or an outright reduction in absolute CapEx guidance. This is the leading indicator — it signals that the build-out is peaking and that the period of supply constraint is ending.
Threshold: Two consecutive quarters of declining YoY CapEx growth across two or more of the four primary hyperscalers.
Current status (May 2026): CapEx growth is still accelerating sharply; no inflection yet.
Signal 2: Cloud Segment Gross Margin Compression
What to watch: A decline in reported cloud segment gross margins (AWS, Azure, Google Cloud) for two or more consecutive quarters.
Threshold: A sustained 200+ basis point decline from peak gross margins within a 12-month period.
Why it matters: Gross margin compression is the first financial fingerprint of price-based competition — it appears before operating margin compression because it strips out the timing effects of CapEx depreciation.
Signal 3: API Pricing Deflation Rate Acceleration
What to watch: The rate at which major AI API providers (OpenAI, Anthropic, Google, AWS Bedrock, Azure OpenAI Service) are reducing per-token and per-query pricing for standard inference tiers.
Threshold: A sustained price reduction pace exceeding 40% per year for a leading frontier model's standard inference tier.
Why it matters: API pricing is the most direct, real-time signal of supply/demand balance in the AI compute market. It is the analogue to bandwidth pricing in the fiber bust.
Signal 4: NVIDIA Revenue Growth Deceleration
What to watch: A marked slowdown in NVIDIA's data center revenue YoY growth rate, particularly if accompanied by inventory build or order book commentary suggesting slower forward demand.
Threshold: Data center revenue growth declining below 20% YoY after being above 100% in the prior period.
Why it matters: NVIDIA's data center revenue is a real-time proxy for hyperscaler GPU procurement. A deceleration is a forward indicator for compute supply growth inflection 12–18 months later, given the deployment lag.
Secondary Inflection Indicators (Confirming Signals)
Signal 5: Public Announcements of AI Project Cancellations or Pauses
What to watch: Enterprise announcements of scaled-back AI deployments, delayed pilots, or explicit guidance commentary about ROI challenges from AI investments.
Why it matters: Demand-side disappointment, if widespread, would shorten the absorption window for new compute supply and accelerate the timing of the price war.
Signal 6: Hyperscaler "Vintage" GPU Discounting
What to watch: Emergence of a visible secondary market for prior-generation AI accelerators (e.g., H100s being displaced by B200s), or hyperscalers offering significant discounts on older-generation compute tiers.
Why it matters: This is the direct analogue to "dark fiber" — it signals that installed capacity is no longer fully absorbed at current pricing.
Signal 7: Cloud Segment Valuation Multiple Compression
What to watch: A re-rating of cloud/AI infrastructure businesses by public market investors, reflected in declining EV/Revenue or EV/EBITDA multiples for cloud reporting segments, even as absolute revenue grows.
Why it matters: Markets lead operating reality. If investors begin pricing cloud businesses as utilities rather than high-growth software franchises, it provides a forward signal of the consensus view on long-term margin trajectory.
Signal 8: Hyperscaler Management Commentary Shift
What to watch: A change in earnings call language from capacity-constrained framing ("we could sell more if we had more capacity") to utilization-focused framing ("we are focused on improving utilization of deployed capacity").
Current status (May 2026): All four companies remain in explicitly supply-constrained mode. Microsoft stated in Q1 FY2026 earnings that cloud supply constraints are expected to persist through at least June 2026. No inflection yet.
Why it matters: This is the qualitative confirmation that capacity has transitioned from scarce to abundant.


I'm Joshua, a financial advisor from Reno, Nevada. As someone who co-founded and built a trust company and investment advisory firm from the ground up, I’m passionate about sharing the lessons I've learned on my financial journey of 30+ years to guide and empower clients to secure their financial futures. Using active macroeconomic quantitative and tax avoidance strategies, I mitigate risk and help families achieve lasting financial independence, acting as guardians for future generations. Trust, consistency, and accessibility are at the heart of all my long-lasting client relationships.

Disclaimer
This document contains "forward-looking statements," which are based on current expectations, estimates, and projections. These statements are not guarantees of future performance and involve risks, uncertainties, and assumptions that are difficult to predict. Statements regarding projected capital expenditures, future market conditions (such as price wars and commoditization), margin compression, and the migration of economic value are inherently speculative. Actual results may differ materially from those expressed or implied in this analysis.
The CapEx figures cited in this analysis are sourced directly from Q1 2026 earnings releases and management guidance (April 29, 2026). The combined $725 billion 2026 figure reflects guidance midpoints as compiled by the Financial Times following Q1 earnings. Individual company 2025 actuals are sourced from audited annual financial statements. The breakdown of CapEx components is based on a model synthesized from public sources, including vendor pricing, industry conference presentations, and hyperscaler infrastructure cost analyses.
The author (Joshua Barone), their firm, and/or their clients may have financial interests or positions in the securities of companies mentioned in this report. This may represent a conflict of interest. The views expressed are the author's own and do not necessarily reflect the views of any affiliated organization. Investing in securities involves risks, including the potential loss of principal. Past performance and historical market trends are not indicative of future results.
References
Primary Financial Sources
1. Amazon.com, Inc. Q1 2026 Earnings Release (April 29, 2026). Amazon.com Announces First Quarter Results. Amazon Investor Relations. https://ir.aboutamazon.com/news-release/news-release-details/2026/Amazon-com-Announces-First-Quarter-Results/
2. Alphabet Inc. Q1 2026 Earnings Release (April 29, 2026). Alphabet Announces First Quarter 2026 Results. U.S. Securities and Exchange Commission, Exhibit 99.1. https://www.sec.gov/Archives/edgar/data/1652044/000165204426000043/googexhibit991q12026.htm
3. Meta Platforms, Inc. Q1 2026 Earnings Release (April 29, 2026). Meta Reports First Quarter 2026 Results. Meta Investor Relations. https://investor.atmeta.com/investor-news/press-release-details/2026/Meta-Reports-First-Quarter-2026-Results/default.aspx
4. Microsoft Corporation. Q1 FY2026 Earnings Release (October 29, 2025). FY26 Q1 Press Release and Webcast. Microsoft Investor Relations. https://www.microsoft.com/en-us/investor/earnings/fy-2026-q1/press-release-webcast
5. Microsoft Corporation. Q1 FY2026 Performance Overview. Microsoft Investor Relations. https://www.microsoft.com/en-us/investor/earnings/fy-2026-q1/performance
Industry & Market Research
6. Financial Times. (April 29, 2026). Big Tech AI Capex Reaches $725 Billion for 2026, Up 77% from Last Year. [As cited in Tom's Hardware and Yahoo Finance coverage of Q1 2026 earnings.] https://www.tomshardware.com/tech-industry/big-tech/big-techs-ai-spending-plans-reach-725-billion
7. Apollo Academy. (February 22, 2026). Putting the Total Amount of Hyperscaler Capex Into Perspective. Apollo Global Management. https://www.apolloacademy.com/wp-content/uploads/2026/02/Hyperscaler-capex-022226_v2.pdf
8. CreditSights. (November 24, 2025). Technology: Hyperscaler Capex 2026 Estimates — Record-Breaking Capital Expenditure Projections. https://know.creditsights.com/insights/technology-hyperscaler-capex-2026-estimates/
9. MUFG Americas. (December 18, 2025). AI Chart Weekly: Hyperscalers' Capex Above $600B in 2026 — Financing the AI Supercycle. https://www.mufgamericas.com/sites/default/files/document/2025-12/AI_Chart_Weekly_12_19_Financing_the_AI_Supercycle.pdf
10. JLL Research. (H1 2026). Data Center Outlook — North America. Jones Lang LaSalle. [Cited for data center power demand figures; report available through JLL subscription.]
11. S&P Global Market Intelligence. (April 26, 2026). Alphabet Earnings Preview: Q1 2026. https://www.spglobal.com/market-intelligence/en/news-insights/research/2026/04/alphabet-earnings-preview-q1-2026
News & Earnings Coverage
12. CNBC. (April 29, 2026). Alphabet (GOOGL) Q1 2026 Earnings. https://www.cnbc.com/2026/04/29/alphabet-googl-q1-2026-earnings.html
13. CNBC. (April 29, 2026). Amazon's Cloud Unit Reports 28% Sales Growth, Topping Estimates. https://www.cnbc.com/2026/04/29/aws-earnings-q1-2026.html
14. CNBC. (April 29, 2026). Meta Q1 2026 Earnings Report. https://www.cnbc.com/2026/04/29/meta-q1-earnings-report-2026.html
15. Reuters. (April 29, 2026). Alphabet Revenue Tops Expectations on Record Quarter for Cloud Unit. https://www.reuters.com/business/alphabets-cloud-unit-beats-quarterly-revenue-estimates-strong-ai-demand-2026-04-29/
16. Directions on Microsoft. (October 30, 2025). Microsoft Q1 FY'26 Earnings: Cloud Supply Constraints to Last Through at Least June 2026. https://www.directionsonmicrosoft.com/microsoft-q1-fy26-earnings-cloud-supply-constraints-to-last-through-at-least-june-2026/
17. Yahoo Finance / Magnificent 7 Earnings Recap. (April 29, 2026). 'Magnificent 7' Earnings Rush Reveals AI Spending Surge, with Hyperscaler Capex Set to Reach $725 Billion in 2026. https://finance.yahoo.com/markets/article/magnificent-7-earnings-rush-reveals-ai-spending-surge-with-hyperscaler-capex-set-to-reach-725-billion-in-2026
Theoretical & Academic Foundations
18. Marathon Asset Management. Capital Cycle Theory. As discussed in: Capital Returns: Investing Through the Capital Cycle (ed. Edward Chancellor). Palgrave Macmillan, 2015.
19. Odlyzko, A. (2001). Internet Traffic Growth: Sources and Implications. University of Minnesota Digital Technology Center. [Cited for dark fiber utilization estimates in the 2000–2002 fiber bust.]
20. CTIA — The Wireless Association. (2021). 2021 Annual Survey. CTIA. [Cited for $300B cumulative carrier CapEx 2010–2020 and ARPU data.]
21. FactSet Research Systems. (2025). Industrial and Utility Sector Operating Margin Benchmarks. FactSet. [Cited for the 15–20% operating margin range for capital-intensive businesses.]


