
Markets Turn Down: A Correction or Something More Sinister?
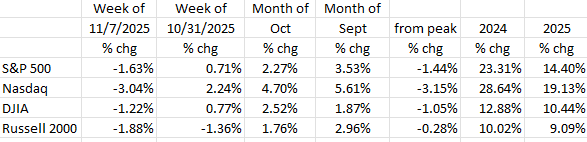
As seen from the table, the first week of November has given back much of the equity market’s October gains (all in the case of the small cap Russell 2000) causing investors to wonder if this is the beginning of a long overdue correction, or something more insidious, such as the anticipation of an oncoming Recession (the incoming macroeconomic data have shown economic softness). Perhaps the now record length of the government shutdown played a role.
It was only a week ago (last week of October) that five of the Magnificent 7 hit all-time record highs: MSFT (10/28), NVDA (10/29), AAPL (10/30), GOOG (10/30), and AMZN (10/31). Since then, all seven have receded, some significantly so (META, TSLA, and even NVDA and MSFT).
While the current economic slowdown is not yet evident in the GDP numbers, in the credit markets, or, until this week, in the equity markets, it is increasingly apparent in the housing sector, in the labor market, and in recent consumer sentiment surveys.
The Fed
At its late October meeting, the Fed cut its target Fed Funds Rate by 25 basis points to 3.75%-4.00%, and the effective rate now appears to be 3.90%. There were two dissenting votes out of the twelve voting members. The newest member, Stephen Miran, dissented, indicating he wanted a 50-basis point decline, while Kansas City Fed President Jeffrey Schmid dissented, indicating that he wanted no rate cut at all, as he was still concerned about rising inflation. The last time two voting members dissented was in July (Waller and Bowman both preferred a rate cut rather than holding rates steady), but, before that, the last double dissent was in 1993!3
Yet, despite the cut, interest rates, as represented by the 10-Year Treasury, rose from 3.95% before the Fed meeting, to 4.16% on November 4th. (They have since fallen back to 4.09% as of this writing (Friday 11/7)). Volatility prevails!
The recent market action raises a question: If the Fed is in easing mode, why the rise in rates? Those who follow the economy and monetary policy closely know that Powell came off as being “hawkish” when he responded to a question regarding the future course of monetary policy at the Fed’s post-meeting press conference (October 29th). Powell quipped: “A further reduction in the policy rate at the December meeting is not a foregone conclusion – far from it.” Those last three words caused market players to rethink their assumptions about rates going forward. Thus, the rate spike.
It appears to us that Powell wanted to emphasize that “policy is not on a preset course,” and that such decisions are on a meeting-by-meeting basis based upon the available economic evidence. That has always been his position and the policy of the FOMC during his chairmanship. And, what he said appears to have accomplished his goal – not to let markets front run the Fed, as that makes Fed policy less effective.
Meanwhile, there is plenty of evidence that the economy is weakening and that the Fed will soon be lowering rates again, likely at its upcoming December 9-10 meeting. Market odds of a 25-basis point rate cut stand at 70% as of this writing.1 While that is down from 90% before Powell’s remarks, it is highly likely because, despite the lack of economic reports due to the government shutdown, private sector reports have all confirmed a slowing economy.
[Note: In defense of Mr. Powell, if he were to tell the markets where he thought the Fed would be with interest rates over the next six months, the markets would move rates there at the start of the next trading session! By not revealing where he believes rates are going is the only way to allow monetary policy to effectively function.]
The Slowing Economy
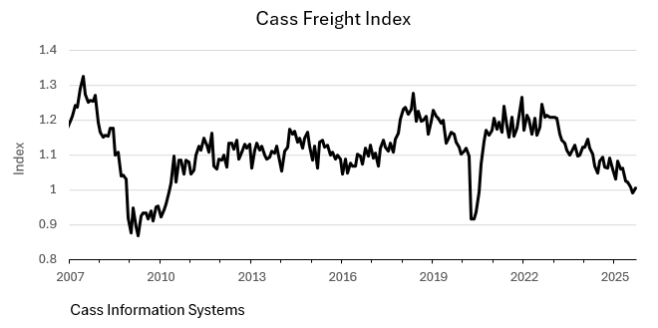
- Freight: It is always a red flag when goods stop moving. The Cass Freight Index is down about -25% from its peak in 2022. The chart shows a rapid deterioration in 2025.
- Zombie Companies, defined as those that don’t have the cashflow to cover their interest expense, are now at their highest level since the pandemic, according to Economist David Rosenberg. He says that more than 21% of companies in the Russell 3000 (i.e., 639 companies) meet that definition (Rosenberg Research, Breakfast with Dave, 11/3/25).
Housing
Our forecast early in the year that the rate of inflation would be at or near the Fed’s 2% goal by year’s end looks to be prescient. We now think this will occur sometime in Q1. Here’s why:
- Apartment List showed rental deflation at -0.8% M/M in October, negative for three months in a row. In fact, 50 of the largest 54 metropolitan areas now show falling rents.
- According to the Bureau of Labor Statistics, the multi-family vacancy rate is at an all-time high (see chart). In addition, prior overbuilding (600K new multi-family units in 2024 and 243K units completed in the first six months of 2025) is now hitting a market where demand is soft.

- We expect rental deflation to continue as far as the eye can see into 2026. According to Apartment List, “…the supply boom still has a bit of a runway remaining, and the demand outlook [is] weaker…”
- Weakness in housing has also caused the S&P 500 Homebuilding Stock Index to slip nearly -18% from its early September peak. This looks like a trend that won’t be ending soon.

Employment
While we didn’t get a jobs report on Friday due to the government shutdown, economists surveyed by Dow Jones expect it would have shown a decline of -60K, with the U3 Unemployment Rate rising to 4.5% (the last official rate was 4.3% in August). The U6 Unemployment Rate was at 8.1% in August (up from 7.9% in July), the highest it has been, outside of the pandemic, since December 2017. It, too, is likely to have risen in the August-September period.
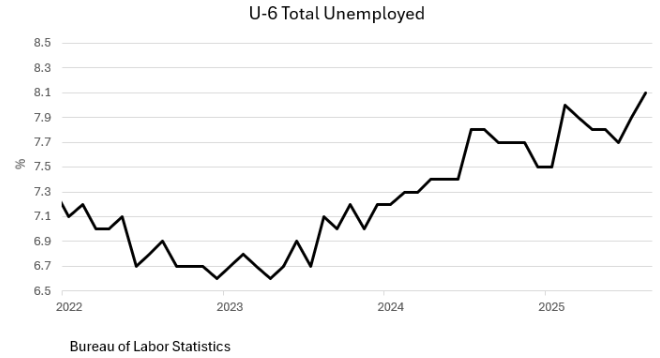
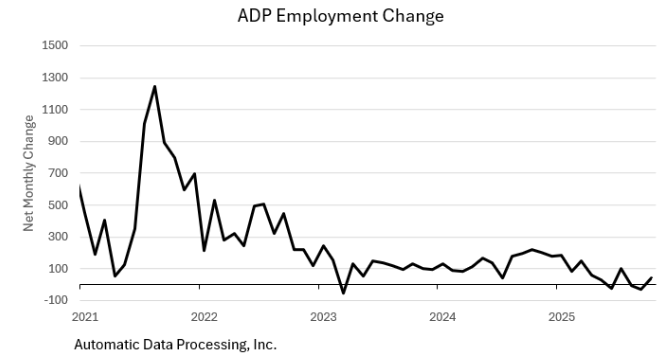
The chart shows the rise in 2025, and that U6 Unemployment has been rising for the last two years. The difference between the U6 Unemployment number (8.1%) and the more commonly referenced U3 rate (4.5%) is that U6 takes into account those working part-time but wanting full-time work but unable to find it. Due to the government shutdown, we didn’t get either September’s or October’s official unemployment numbers. But we do have private sector data to reference. ADP has a long track record that is highly correlated with the official BLS data. The chart shows the falloff in the ADP jobs numbers in 2025. While ADP data showed a gain of +42K jobs in October, that was concentrated in large businesses (500+ employees) which grew +73K.2 More economically sensitive medium sized and small businesses shrank their employee numbers (-21K and -10K respectively).
According to Nela Richardson, ADP’s Chief economist:
“Three in four workers in the United States… work in a smaller firm with headcount under 250, so seeing weakness and softness there is a concern.”
To further show emerging weakness in the labor market, there have been significant layoff announcements of late at major companies:
- IBM: -8,000;
- AMZN: -14,000;
- UPS: -48,000;
- TGT: -1,800.
Challenger, Gray & Christmas counted job cuts of more than -153K in October, up from -84K in September and -1.1 million cuts year to date. This was the highest layoff count for any October since 2003, and 2025 has been the worst year for layoffs since 2009. For comparative purposes, the -153K October layoff announcements are 175% of what they were in October 2024, and the -1.1 million cuts total for 2025 are 65% higher than in the same 2024 period.
One more observation on this unemployment file: the unemployment rate for young men (20-24 years old) at 10% and rising, is now the highest it has been since the pandemic. This unemployment gauge is a reliable leading indicator.

Final Thoughts
While the Fed “isn’t on a predetermined path” and will make its interest rate decisions based on data available at the time of its meeting, the trend in the employment data, one of the Fed’s major mandates, indicates the Fed will be on an easing campaign well into 2026. Note to Mr. Powell: That’s our reading of the hard data!
That observation is backed up by a host of reports showing a slowing economy, including:
- a slowdown in freight movements;
- a rapid rise in zombie companies, those that don’t have the cashflow to cover their interest expense;
- weakness in housing, including evidence of rent deflation, record high vacancies all while new units continue to come to market at a record pace.
- In the labor market, there is lots of evidence of emerging weakness including rising layoffs. Pink slips in October were at 175% of where they were in October ’24.


Dr. Robert Barone, Ph.D. is an economist whose storied career spans numerous decades and positions within the world of finance. Since gaining his Ph.D. in Economics from Georgetown, he has been a Professor of Finance (University of Nevada), a community bank CEO (Comstock Bancorp), and a Director of the Federal Home Loan Bank of San Francisco, where he served as its Chair in 2004. He lives and breathes the world of finance, continuing to provide clients and avid Forbes readers with his latest market insights.

(Joshua Barone and Eugene Hoover contributed to this blog.)
Robert Barone, Joshua Barone and Eugene Hoover are investment adviser representatives with Savvy Advisors, Inc. (“Savvy Advisors”). Savvy Advisors is an SEC registered investment advisor. Material prepared herein has been created for informational purposes only and should not be considered investment advice or a recommendation. Information was obtained from sources believed to be reliable but was not verified for accuracy.
Ancora West Advisors, LLC dba Universal Value Advisors (“UVA”) is an investment advisor firm registered with the Securities and Exchange Commission. Savvy Advisors, Inc. (“Savvy Advisors”) is also an investment advisor firm registered with the SEC. UVA and Savvy are not affiliated or related.
Reference:
1 https://www.pimco.com/gbl/en/insights/fed-delivers-despite-data-drought
2 https://www.nbcnews.com/business/economy/adp-jobs-october-trump-rcna242070

