
The Barone Boomer Inventory Index: Measuring the Slow-Release Housing Supply Wave
The Barone Boomer Inventory Index
Executive summary
The Barone Boomer Inventory Index is a proposed housing-market indicator designed to measure whether Baby Boomer-owned homes are gradually becoming a material source of existing-home supply. The central claim is not that the United States faces an imminent national housing crash from a “silver tsunami.” The more useful hypothesis is narrower and more measurable: Boomer-owned homes may create a slow-release inventory channel through downsizing, assisted-living transitions, estate sales, probate, mortality-driven turnover, and inherited-property disposition.
The index is built around a distinction that most housing commentary blurs: a demographic exit is not the same thing as a market listing. A Boomer household can leave a home through death, care transition, relocation, or intra-family transfer, but the property may be listed immediately, sold off market, converted to rental, occupied by an heir, held vacant during probate, or delayed for repairs. The index therefore separates gross demographic release, market-visible listing release, transaction absorption, and net inventory impact.
The research motivation is straightforward. The Census Bureau reported 82.9 million owner-occupied housing units in the 2019-2023 ACS 5-year estimates, up from 76.4 million in the 2014-2018 period (Census Bureau). Independent ACS-based research estimates that Americans age 55 and older owned 54.0% of U.S. homes in 2023 and that Baby Boomers accounted for more than 37% of homeowners nationwide (Construction Coverage). Fannie Mae’s earlier housing-demographics work estimated that Baby Boomers inhabited 32 million owner-occupied homes and projected 13.1 million to 14.6 million older-owner exits from 2026 to 2036 (Fannie Mae).
The practical conclusion is that Boomer inventory release is too large to ignore but too slow-moving to treat as a stand-alone crash catalyst. A defensible working assumption is roughly 0.9 million to 1.1 million gross Boomer housing exits per year, with perhaps 0.6 million to 0.8 million homes becoming market-visible listed supply within the year after adjusting for inheritance, rental conversion, off market transfer, and timing lags. Against an April 2026 existing-home sales pace of 4.02 million SAAR, that listed-supply range is material enough to affect regional absorption, builder competition, price cuts, and local credit exposure, but not automatically enough to overwhelm national demand (NAR).
Thesis
The Barone Boomer Inventory Index starts from a simple proposition: housing supply should be measured not only by current listings and new construction, but also by the latent stock of owner occupied homes controlled by aging households. Baby Boomers are now moving through the age bands where mortality, health events, widowhood, downsizing, and care transitions become increasingly relevant. These transitions can release homes into the existing-home market even if new construction remains constrained.
This does not mean that every Boomer home becomes a forced sale. Aging in place remains powerful, low mortgage balances reduce forced-selling pressure, heirs may retain homes, and many markets still have strong household-formation demand. The index is therefore designed as a flow monitor rather than a deterministic demographic forecast. It asks whether the realized flow of Boomer-linked listings and sales is exceeding an age-adjusted expected baseline.
The signal becomes economically important when three forces overlap: rising Boomer-linked housing release, weak absorption by younger buyers, and elevated competing new-home supply.
In that setting, the inventory narrative can shift from “scarcity supports prices” to “supply normalization pressures marginal pricing.” The effect should be regional before it is national, with the highest risk in older-owner-heavy, slower-growth markets and in Sunbelt builder markets where new home supply competes directly with older resale stock.
Why a new index is needed
Traditional housing indicators are necessary but incomplete. Existing-home inventory tells how many homes are currently listed. New-home sales and months of supply show builder exposure. Mortgage rates measure affordability pressure. None of those indicators directly measures the demographic source of supply.
The Census/HUD new-home sales series is useful for builder inventory, homes for sale, months of supply, and new-home pricing, but it does not identify whether existing-home listings are coming from aging owners (Census New Residential Sales). Realtor.com and Redfin provide timely inventory and market-absorption data, but the public versions are generally not designed to classify seller age, estate-sale channels, probate events, or move-to-care transitions (Realtor.com Research, Redfin Data Center).
The Barone Boomer Inventory Index fills that gap by combining demographic denominators, parcel level ownership data, listing flows, transaction records, probate signals, mortality baselines, and senior-housing transition proxies. The goal is not to replace standard inventory indicators. The goal is to explain where inventory is coming from, whether the source is temporary or structural, and whether the market is absorbing it smoothly.
Index definition
The headline metric is the Boomer Release Rate. It measures Boomer-linked housing releases per 1,000 estimated Boomer-owned homes, annualized by geography and period.
The denominator is the estimated Boomer-owned housing stock in geography g at time t. The numerator is the probability-weighted count of Boomer-linked listing or sale events, classified by channel and adjusted to avoid double-counting the same dwelling across probate, deed, listing, and closing events.
The second core metric is Excess Boomer Release. It compares observed release against an age adjusted expected baseline.
where the expected baseline is the release rate implied by the local Boomer age distribution alone, and excess release is the amount by which observed release exceeds that age-implied baseline. A positive excess release indicates that older-owner housing is being released faster than the local age structure would predict.
The key methodological point is that the index should not flag a market simply because many older owners exist there. A market should be flagged when older-owner housing release is rising faster than its own age structure would predict, and when the local market is failing to absorb that release at normal prices and normal days on market.
Flow framework
The index separates four layers of the housing-release process.
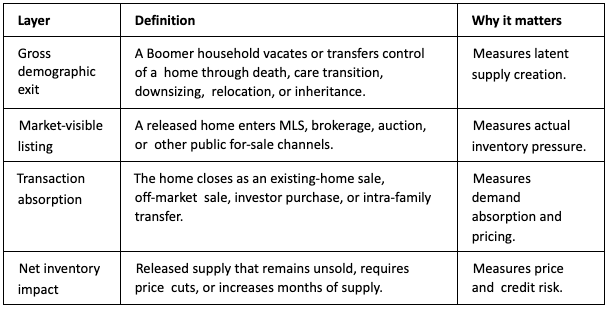
This distinction is essential because demographic events are often legal or household events before they become market events. A death may trigger probate, a deed transfer, a trust transfer, repairs, heir occupancy, rental conversion, and only later a listing. Counting each of those events separately would overstate supply. The index therefore counts each dwelling once at the release level, then tracks the downstream timing and disposition.
Data architecture
The public baseline layer should use ACS, AHS, Census/HUD housing data, mortality data, and public market-inventory sources. ACS is the preferred public source for estimating owner-occupied housing by age of householder, geography, tenure, and household characteristics (Census ACS). AHS is useful for structural calibration because it covers housing-unit characteristics, older households, recent
movers, financing, and housing condition (Census AHS). CDC WONDER can support age- and county level mortality baselines for expected housing exits (CDC WONDER).
The forensic layer should use parcel, assessor, recorder, deed, MLS, probate, and senior-housing data. ATTOM’s property data API can support parcel, transfer, foreclosure, and property characteristic enrichment through address, APN, ATTOM ID, and geospatial lookups (ATTOM Property Data API). Cotality describes API, bulk, data-marketplace, and MCP delivery options for property and location intelligence, which can support ownership, transfer, mortgage, and property-market enrichment (Cotality Data). NIC MAP is relevant because senior-housing occupancy, move-in/move out activity, construction, and property-type segmentation can proxy care-transition pressure by geography (NIC MAP).
The minimum viable dashboard can start without parcel-level seller-age attribution. A Phase 1 version can estimate Boomer owner stock by MSA using ACS, then overlay Redfin, Realtor.com, Census/HUD new-home supply, and county mortality baselines. A Phase 2 version should add vendor property data, ownership duration, seller probability scoring, MLS listing events, and deed-type classification. A Phase 3 version should add probate matching, mortality linkage, senior-housing transition data, mortgage/credit data, and local bank or builder exposure overlays.
Forensic channel classification
Every Boomer-linked listing or sale should be assigned to one primary release channel. The release channels are not merely labels; they identify the economic mechanism behind the supply.

The cleanest implementation should probability-weight seller age and channel confidence. Seller age is often unobserved, estate records vary by state, trusts can obscure beneficial ownership, and heirs may hold homes for months or years. A robust version of the index should therefore store both a primary channel and a confidence score.
Core KPI set
The index should publish a concise set of top-line metrics, then allow drill-down by county, MSA, property type, price tier, and release channel.


Scenario math
The starting stock estimate is roughly 31 million to 32 million Boomer-owned homes. Fannie Mae’s research estimated that Baby Boomers inhabited 32 million owner-occupied homes, while the ACS based 2023 ownership count implies a similar order of magnitude when Boomer homeownership share is applied to the 82.9 million owner-occupied units reported in the 2019-2023 ACS release (Fannie Mae, Census Bureau, Construction Coverage).
Using a 31.5 million midpoint, the annual gross release scenarios look like this:

The practical market-visible listing case should be lower than gross releases. If 60% to 75% of the practical base of roughly 945,000 gross releases (the 3.0% scenario) become listed supply within a year, then the index would imply roughly 567,000 to 709,000 market-visible homes annually. That is meaningful compared with the current existing-home sales run rate, but it is not automatically a national glut. NAR reported April 2026 existing-home sales at a 4.02 million seasonally adjusted annual rate, with total inventory at 1.47 million units (NAR).
The interpretation should therefore be disciplined. The index is strongest as a regional dispersion tool, not a national crash counter. A market with rising Boomer release, weak young-buyer absorption, high new-home inventory, and rising price cuts deserves a yellow or red signal. A market with rising Boomer release but strong employment, high incomes, strong in-migration, and tight physical supply may absorb the flow without major price pressure.
Threshold framework
The Barone Boomer Inventory Index should use green, yellow, and red thresholds. Thresholds should be calibrated locally because some markets naturally have more retirees, more estate activity, and more long-tenure owners.
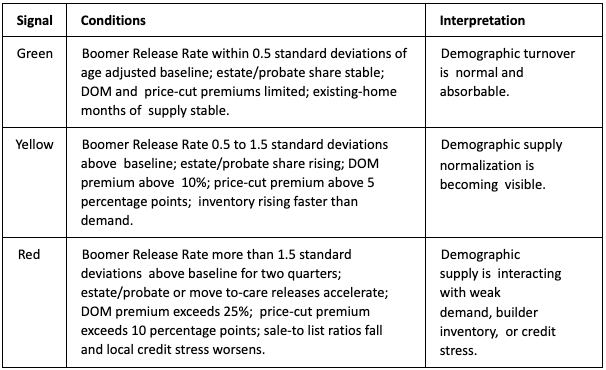
The red signal should require confirmation across channels. A simple rise in Boomer listings is not enough. The higher-quality signal is a simultaneous rise in excess Boomer release, estate/probate share, days-on-market premium, price-cut premium, new-home competition, and local credit stress.
Regional applications
The index should classify geographies into market archetypes. Older-owner-heavy, slow-growth markets are the most direct test of the thesis because local younger demand may be insufficient to absorb rising inventory. Aging suburbs are another key archetype because they combine long-tenure owners, dated housing stock, large homes, renovation needs, and potential estate-sale flow.
Sunbelt builder markets deserve separate treatment. A Boomer resale release in a market with limited new construction may be absorbed easily. The same release in a market with elevated new home months of supply can force builders and sellers into direct competition. That dynamic is especially important when builders offer rate buydowns or incentives that older resale sellers cannot easily match.
Retirement and care-transition markets require an additional lens. A move to assisted living or memory care can release a home, but the timing may depend on family decisions, repairs, probate, Medicaid planning, or estate administration. Senior-housing data can therefore operate as a leading or coincident indicator rather than a direct listing measure.
Investment and credit implications
The index has several practical uses for investors, lenders, builders, and advisors.
The index should not be used as a simple bearish housing indicator. The strongest use case is relative-value and risk-screening analysis. It should identify where demographic supply is likely to matter more than consensus expects and where the “permanent scarcity” narrative is overstated.
Implementation roadmap
The first version should be a public-data prototype. It should estimate Boomer owner stock by MSA, track existing-home inventory from Realtor.com and Redfin, track new-home competition from Census/HUD, and use CDC mortality baselines to estimate expected demographic pressure. This version will not identify actual Boomer sellers, but it can rank markets by latent demographic pressure and absorption vulnerability.
The second version should add vendor-enriched transaction data. Parcel, assessor, deed, and MLS feeds can identify likely Boomer-linked listings through ownership duration, seller probability, senior exemptions, trust or estate language, deed type, listing remarks, and price-cut behavior. ATTOM and Cotality-style property data can support this layer, subject to coverage, licensing, and field availability (ATTOM Property Data API, Cotality Data).
The third version should become a forensic attribution model. It should match probate records, mortality events, deed transfers, listing events, senior-housing transition data, and local credit indicators. At that stage, the index can distinguish ordinary aging from excess release, separate demographic release from financial distress, and identify where the released inventory is creating measurable market pressure.
Limitations
The main limitation is that seller age is often unobserved. Any national index must therefore use probabilistic age inference, ownership-duration priors, ACS denominators, senior-exemption flags, and vendor household-age models. That creates model risk.
The second limitation is event timing. Death, probate, listing, transfer, and closing can occur months or years apart. A home can be released from Boomer control long before it enters the active market, and a deed transfer can occur without a public listing. The index must therefore store event dates, channel confidence, and lag distributions.
The third limitation is regional comparability. Probate processes, deed types, senior exemptions, MLS field availability, and county records differ by state and municipality. A comparable national index requires local normalization and transparent confidence scoring.
The fourth limitation is causal interpretation. A rise in Boomer-linked listings may occur at the same time as higher mortgage rates, weaker employment, builder discounting, or investor withdrawal. The index should not attribute all price pressure to demographics. The right test is whether Boomer linked supply predicts incremental days-on-market, price cuts, or sale-to-list deterioration after controlling for broader market conditions.
Conclusion
The Barone Boomer Inventory Index reframes the Baby Boomer housing story as a measurable flow problem. The question is not whether millions of older-owner homes exist. They do. The question is whether those homes are entering the market faster than age-adjusted baselines, whether they are becoming visible listings or non-market transfers, and whether local demand can absorb them without price concessions.
The best working hypothesis is that Boomer housing release will be a slow-release structural headwind to the permanent-scarcity narrative. It should show up first in regional dispersion, builder competition, estate-sale activity, renovation demand, and local credit exposure. It becomes most powerful when demographic release collides with high mortgage rates, weak younger-buyer demand, high new-home supply, or local labor-market stress.
The index’s value is therefore not in predicting an immediate housing crash. Its value is in turning a vague demographic narrative into an auditable, geographically specific, channel-level dashboard that can be tested month by month and quarter by quarter.
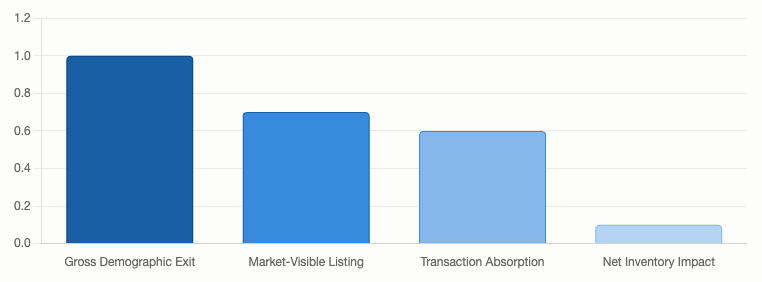
Annual Flow of Boomer-Owned Housing Inventory Release (Illustrative)
This visualization illustrates the proposed flow framework, showing the reduction from gross demographic exits to market-visible listings and net inventory impact. It highlights the critical distinction that not all vacated Boomer homes immediately enter the for-sale market, due to factors like inheritance, rental conversion, and timing lags.
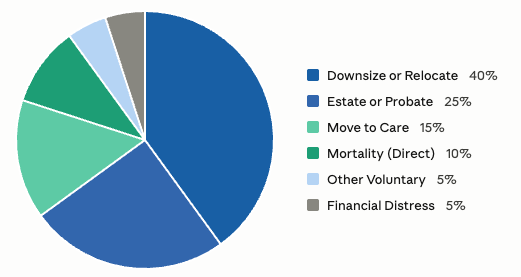
Illustrative Composition of Boomer-Linked Housing Releases by Channel
This chart depicts a hypothetical breakdown of Boomer-linked housing supply by its underlying release channel. It demonstrates the index's ability to classify the economic mechanism behind inventory release, distinguishing between voluntary transitions, health-related moves, and mortality driven supply.


I'm Joshua, a financial advisor from Reno, Nevada. As someone who co-founded and built a trust company and investment advisory firm from the ground up, I’m passionate about sharing the lessons I've learned on my financial journey of 30+ years to guide and empower clients to secure their financial futures. Using active macroeconomic quantitative and tax avoidance strategies, I mitigate risk and help families achieve lasting financial independence, acting as guardians for future generations. Trust, consistency, and accessibility are at the heart of all my long-lasting client relationships.

References
U.S. Census Bureau. “Nearly All U.S. Counties Had More Homeowners Than Renters.” 2019–2023 American Community Survey 5-Year Estimates. https://www.census.gov/newsroom/press-releases/ 2024/acs-5-year-homeowners-renters.html
Construction Coverage. “Baby Boomer-Dominant Housing Markets [2024].” https:// constructioncoverage.com/research/baby-boomer-dominant-housing-markets
Fannie Mae. “Housing Insights: The Coming Exodus of Older Homeowners.” https:// www.fanniemae.com/media/20281/display
National Association of Realtors. “NAR Existing-Home Sales Report Shows 0.2% Increase in April” (April 2026). https://www.nar.realtor/newsroom/nar-existing-home-sales-report-shows-0-2-increase in-april
Disclosures
This document contains economic analysis and market-related commentary regarding housing supply, demographic trends, and their potential impact on regional absorption, builder competition, price adjustments, and local credit exposure. The following disclosures are provided for informational purposes:
This material is provided for informational and educational purposes only. It does not constitute, and should not be construed as, investment, financial, tax, legal, accounting, or real estate advice, nor a recommendation to buy, sell, or hold any security, property, or other asset.
Nothing in this document is an offer to sell or a solicitation of an offer to buy any security, interest, or product, and it should not be relied upon in connection with any investment or transaction decision.
This document contains forward-looking statements and scenario-based estimates, including illustrative release rates, listing-flow ranges, and absorption assumptions. These are hypothetical, depend on assumptions that may prove incorrect, and are not guarantees of future results; actual outcomes may differ materially from any projection presented here.
Certain data and statistics referenced in this document were obtained from third-party sources believed to be reliable, including those listed in the References section. Such information has not been independently verified, and its accuracy, completeness, and timeliness are not guaranteed.
Readers should exercise their own judgment and conduct independent due diligence when interpreting the implications of demographic and housing-market trends, and should consult qualified investment, tax, legal, accounting, and real estate professionals before making any decision.
The views and analysis expressed herein are those of the author as of the date of publication and are subject to change without notice. Neither the author nor any affiliated party assumes any obligation to update this document or any information contained in it.


