
Fed Should Act as Economy Slows—Will Politics Delay It?
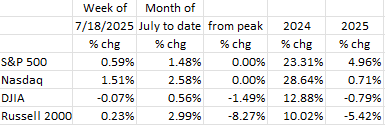
Both the S&P 500 and the Nasdaq closed once again at record highs on Friday (July 18).1 The DJIA was off marginally for both the week (-0.07%) and year to date (-0.79%).2 The Russell 2000, the small-cap index, is the canary in the coal mine. Generally speaking, small caps lead the major averages, especially when the economy slows. And while the Russell 2000 was up marginally for the week and nearly 3% so far in July, it is down nearly -8.3% from its peak and nearly -5.5% year to date.3
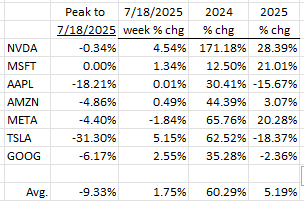
Using a simple average, six of the Magnificent 7 rose for the week (AAPL barely so). Year to date, three (NVDA, MSFT, META) are up double digits, two (AAPL, TSLA) are down double digits, while the other two (AMZN, GOOG) are just above/below the flatline.4
Jobs
While the headline Non-Farm Payroll (NFP) report for June looked relatively strong at +147K, beneath the surface, it wasn’t.5 First, there is the Birth/Death (B/D) model automatic add-on (ostensibly for small businesses that are not surveyed) at +76K.5 This is a large positive number that is simply added on without regard to the economic environment. The fact is applications for new businesses at the state/local level have fallen off a cliff recently.6 In addition, raw data show that state and local governments laid off -310K in June, but through the magic of seasonal adjustment, that number translated into +80K.5 So, that +80K plus the +76K from the B/D model (i.e., +156K) more than offset the total NFP headline number of +147K. Not much substance here!
ADP, the payroll processor, has its own payroll series which comes out a couple days before the Bureau of Labor Statistics’ NFP report. Since it processes payrolls, we should take its data seriously. The ADP number for June was a loss of -33K jobs.7 (Note: the narrative that the economy is “strong” showed up in the consensus estimate of the ADP number which was +98K, only off by a whopping -131K!) The ADP survey breaks down the data by business size. In this case: small business: -47K, medium sized: -15K, large businesses: +30K.7 In the ADP report, the Education/Health sector lost -52K jobs (negative for three months in a row and in four of the last five), while Professional & Business Services, a proxy for temporary help, fell -56K.7 The latter is highly correlated with the overall health of the labor market.
This weakness in the labor market is backed up by the contraction in the workweek (-0.3% in June vs. May).5 But, in a supposed sign of labor market strength, the U3 Unemployment Rate fell to 4.1% in June from 4.2% in May; markets were expecting a 4.3% reading.8 In fact, had the Labor Force Participation Rate (LFPR), the percentage of the working aged population either working or looking for work and the denominator in the U3 calculation, stayed constant, the U3 rate would have risen to that 4.3% number.9 But the LFPR fell. And it fell because, according to the University of Michigan’s Consumer Sentiment Survey, jobs are “hard to get,” and those already unemployed have become discouraged and have stopped looking, thus lowering the labor force ranks.9
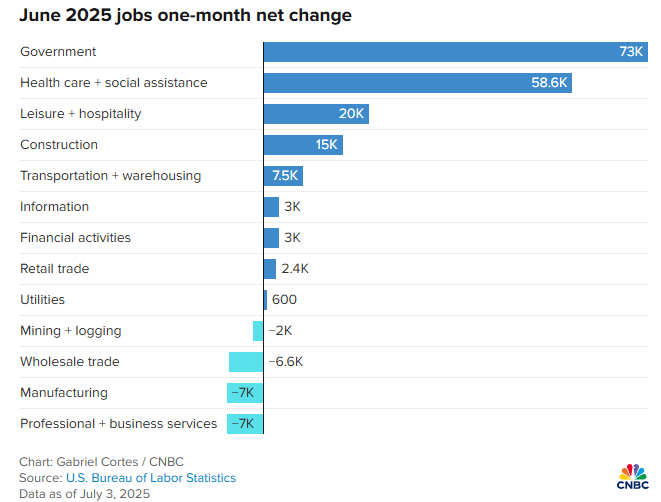
According to economist David Rosenberg, “…private sector payrolls slowed sharply [in June], the most sluggish reading in five months. Stripping out the boom in health care/social assistance, we get +15K which is statistically insignificant and an 80% haircut from the average of the prior six months…”10
Conclusion: The labor market has turned soft and, in our view, we are going to see a significant rise in the unemployment rate by year’s end. And it is this factor that will, in the end, cause the Fed to embark upon a rate lowering cycle.
Inflation
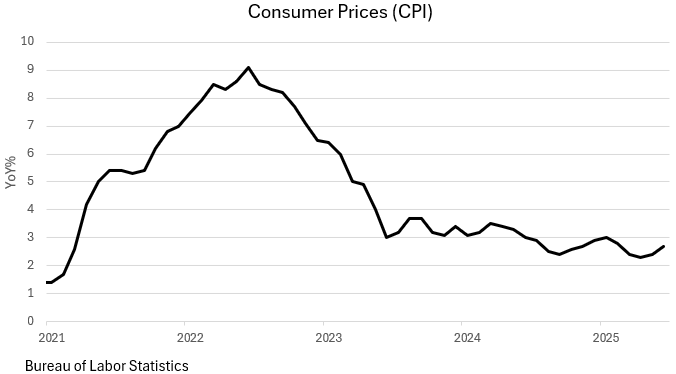
Meanwhile, inflation remained persistent in June with the CPI rising at a hotter than expected +0.3% pace.11 Thankfully, the core CPI (ex-food, energy) is up at an annual rate of only 1.1% in the January to June period.12 While airfares (-0.1%), hotel/motel prices (-3.6%) and new (-0.3%) and used (-0.7%) car prices actually fell in June, we did see a pop in the prices of other key goods, notably appliances (+1.9%), toys (+1.8%), recreational goods (+0.8%) and clothing (+0.4%).11 The Producer Price Index (PPI) was better, coming in flat (0.0%) versus a market expectation of +0.2%.13 For the year/year reading, this index was up 2.3%, down from its May 2.7% rate.13 This is good news as PPI often leads the CPI.
The Fed and Interest Rates
The Fed continues to be very concerned (overly so, in our view) about the impact of Trump’s tariffs on inflation (i.e., the “tariff effect”) and thus, despite the soft data strongly supporting lower rates, is unlikely to reduce them at its upcoming July meetings (July 29-30).14 Some economists have even discounted a rate reduction at the Fed’s September meeting set.15 That would leave December as the first rate reduction meeting.
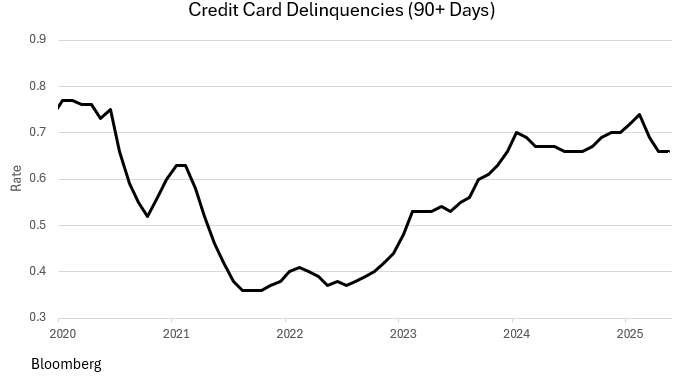
Because changes in monetary policy impact the economy with a long lag, we believe that the Fed should be cutting interest rates now, as the underlying data are quickly deteriorating. Case in point: credit card delinquencies continue at high levels as shown in the chart below. They are now at their ’08-’09 levels.16 The same can be said for auto loans and bank business loans.16 Clearly, the economy is slowing, and the U.S. consumer will likely be cutting spending to pay down their bloated credit card balances and catch up on their auto payments. This will have a negative impact on consumption going forward.
At the press conference of a Fed meeting several quarters ago, Chairman Powell revealed what he called his “super-core inflation index,” i.e., services excluding housing.17 It is a narrower measure than core inflation (which excludes food and energy prices). This measure has now risen at a 1.1% annual rate so far in 2025.17 Hence, it would appear that business and economic conditions are ripe for a rate cutting cycle. But that is the straight economic analysis and excludes political considerations.
Anyone who stays in touch with current events knows that the media has hyperventilated over the President’s pressure on the Fed, and Chairman Powell in particular, to lower interest rates.18 The Fed was wisely set-up by Congress in the early 1900s as “independent” from other branches of government, i.e., the President has no jurisdiction aside from the ability to nominate candidates for vacant Federal Reserve Board seats. The press has been reporting that the President is looking for ways to “fire” Chairman Powell, but it is clear that the President doesn’t have such power.18 (Note: There is the “incompetent” argument. The White House thinks that Powell can be removed for such. And they appear to be pursuing the large cost overruns to rehab the Fed’s HQ Building in Washington, D.C. as proof. We doubt this will stick.)
One question that remains in the background (and unspoken) is whether the Fed would, to spite the President, not lower rates when they otherwise would have!! We think such a scenario has a low probability; after all, there are 11 other voting members of the FOMC and Chairman Powell has always acted with integrity.
Housing
Another market needing rate relief is housing. The number of months of supply of existing homes for sale is now above the pandemic highs of 2020 as are rental vacancies.19
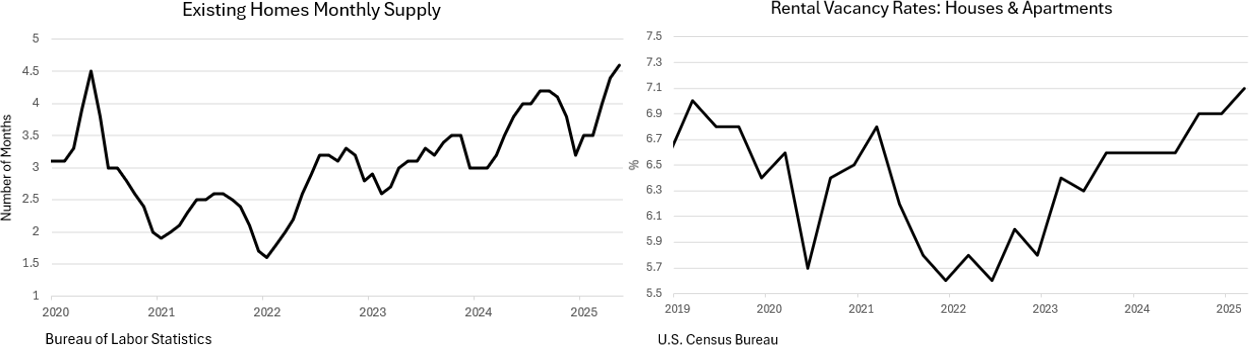
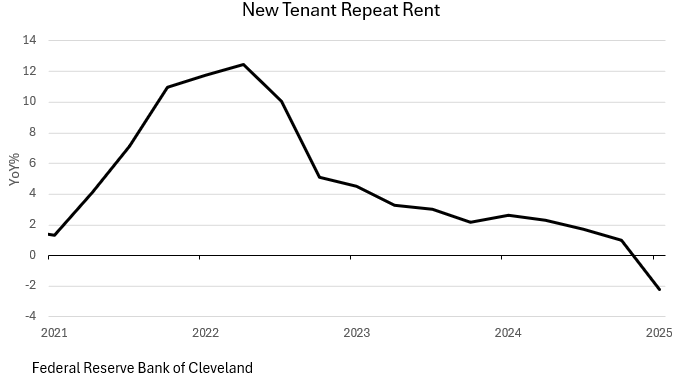
As a result, rents have begun to fall; and that will end up being a positive for the inflation file going forward.19 Net household formation (mainly in the population aged 25-34 that are forming households for the first time) has fallen to <1% at an annual rate, while homebuilders continue to produce new homes at their former rates when net household formation was higher.20
The resulting excess supply will weigh on new home prices and ultimately will reduce construction activity. Markets have already factored this in, as, despite the equity markets’ recent record highs, the Homebuilders’ Index in the S&P 500 is off -30% from its cycle peak.21 Hence, our view that home prices, both new and existing, are at or have passed their peaks for this cycle.
Final Thoughts
Both the S&P 500 and the Nasdaq closed again at record highs on Friday, July 18.1 But the small-cap Russell 2000, the canary in the coal mine, and the old economy industrials, the DJIA, appear to be singing from a different hymn book. Both are down for the year, the Russell by more than -5%.3 They appear to be telling us a different story regarding the state of the economy than are the large caps in the S&P 500. The tech heavy Magnificent 7 are also sending mixed signals. Nvidia, Microsoft and Meta are off to the races, while Apple and Tesla are down significantly year to date. Amazon and Google are flat.4
The payroll report looked strong on the surface, but a deep dive shows emerging weakness. Excluding the automatic add-on from the Birth/Death model calculation and the fact that state and local governments laid off -310K people in June, it is likely that payrolls were flat.5 In fact, ADP, the payroll processor, reported a loss of -33K jobs in June.7 Since they actually process payrolls, their number should be taken seriously. Unfortunately, it isn’t.
Interest rates are the topic du jour. Controversy has erupted as the Trump Administration wants the Fed to lower rates with the President name-calling the Fed Chair.18 The CPI and the PPI appear to be slowly moving toward the Fed’s 2% inflation target.11 13 Our view is that, unforeseeable circumstances notwithstanding, because there is a long lag in the transmission of monetary policy, the Fed should be acting to lower rates now, especially since the consumer is starting to struggle (rising delinquencies).16 But the politics of the day may indeed get in the way of good policy.
Housing usually leads the way in the business cycle, and this time appears to be no different. In the existing home space, inventories are high and rising, and vacancy rates are too.19 It appears to us that home prices have peaked.21


Dr. Robert Barone, Ph.D. is an economist whose storied career spans numerous decades and positions within the world of finance. Since gaining his Ph.D. in Economics from Georgetown, he has been a Professor of Finance (University of Nevada), a community bank CEO (Comstock Bancorp), and a Director of the Federal Home Loan Bank of San Francisco, where he served as its Chair in 2004. He lives and breathes the world of finance, continuing to provide clients and avid Forbes readers with his latest market insights.

(Joshua Barone and Eugene Hoover contributed to this blog.)
Robert Barone, Joshua Barone and Eugene Hoover are investment adviser representatives with Savvy Advisors, Inc. (“Savvy Advisors”). Savvy Advisors is an SEC registered investment advisor. Material prepared herein has been created for informational purposes only and should not be considered investment advice or a recommendation. Information was obtained from sources believed to be reliable but was not verified for accuracy.
Ancora West Advisors, LLC dba Universal Value Advisors (“UVA”) is an investment advisor firm registered with the Securities and Exchange Commission. Savvy Advisors, Inc. (“Savvy Advisors”) is also an investment advisor firm registered with the SEC. UVA and Savvy are not affiliated or related.
Reference:
1: Edward Jones. (2025). Weekly Stock Market Update. www.edwardjones.com
2: T. Rowe Price. (2025). Global Markets Weekly Update. www.troweprice.com
3: Reuters. (2025). US Stock Market Loses $4 Trillion. www.reuters.com
4: BlackRock Investment Institute. (2025). Weekly Commentary. www.blackrock.com
5: U.S. Bureau of Labor Statistics. (2025). Employment Situation Summary. www.bls.gov
6: Rosenberg Research. (2025). Economic Commentary. www.rosenbergresearch.com
7: ADP. (2025). National Employment Report. www.schwab.com
8: Reuters. (2025). S&P 500 Ends Lower as Recession Fears Take Center Stage. www.reuters.com
9: University of Michigan. (2025). Consumer Sentiment Survey. www.schwab.com
10: Rosenberg Research. (2025). Economic Commentary. www.rosenbergresearch.com
11: Edward Jones. (2025). Weekly Stock Market Update. www.edwardjones.com
12: U.S. Bureau of Labor Statistics. (2025). Consumer Price Index Summary. www.bls.gov
13: Charles Schwab. (2025). Weekly Trader’s Outlook. www.schwab.com
14: Investopedia. (2025). Markets News, April 4, 2025. www.investopedia.com
15: Reuters. (2025). Wall Street Ends Higher After Fed Chief’s Comments. www.reuters.com
16: Federal Reserve Bank of St. Louis. (2025). Consumer Credit Data. www.stlouisfed.org
17: U.S. Bank. (2025). Federal Reserve Calibrates Policy to Keep Inflation in Check. www.usbank.com
18: Investopedia. (2025). Markets News, April 23, 2025. www.investopedia.com
19: U.S. Census Bureau. (2025). Housing Starts and Building Permits. www.census.gov
20: Conference Board. (2025). Leading Economic Index (LEI). www.conference-board.org
21: S&P Dow Jones Indices. (2025). U.S. Equities Market Attributes June 2025. www.spglobal.com
